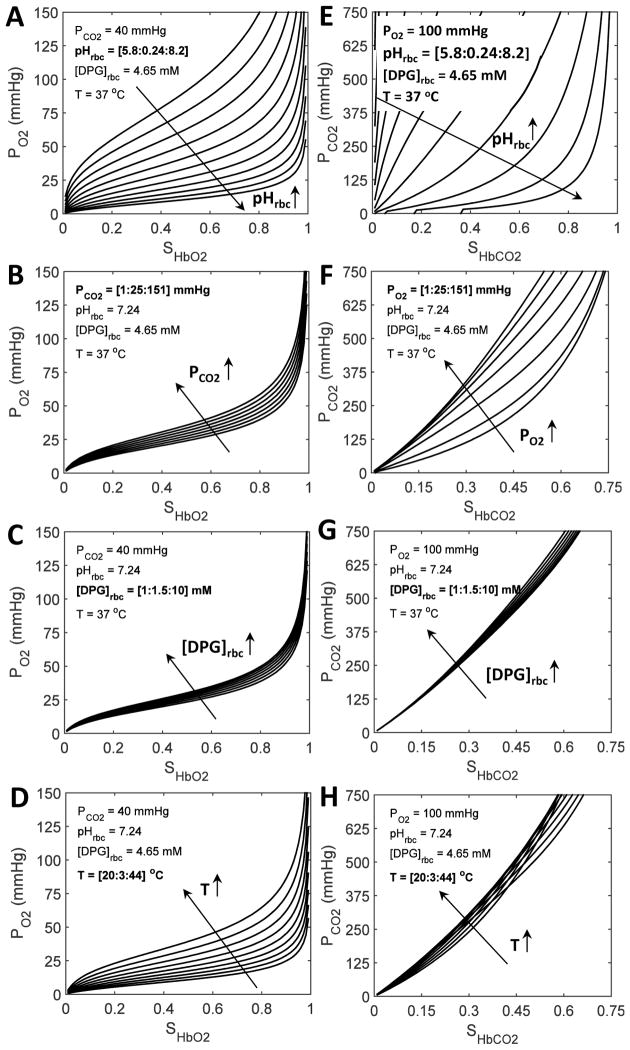
Figure 6. Illustration of the effective numerical inversion of our improved SHbO2 and SHbCO2 equations under varying physiological conditions.
In plots (A–D), the simulations of PO2 as a function of SHbO2 are shown, while in plots (E–H), the simulations of PCO2 as a function of SHbCO2 are shown. In each scenario, three variables are fixed at their standard physiological levels, while the fourth one is allowed to increase by predetermined increments over a large range, as described in detail in the legend to Fig. 4. The inversion computations were carried out using a variant of the Newton-Raphson method (i.e. quasi-Newton-Raphson method) with appropriate initial guesses that guaranteed convergence. These plots are the mirror-images of the corresponding plots in Fig. 4 (but with different scales), illustrating the accuracy of the numerical inversion schemes.

