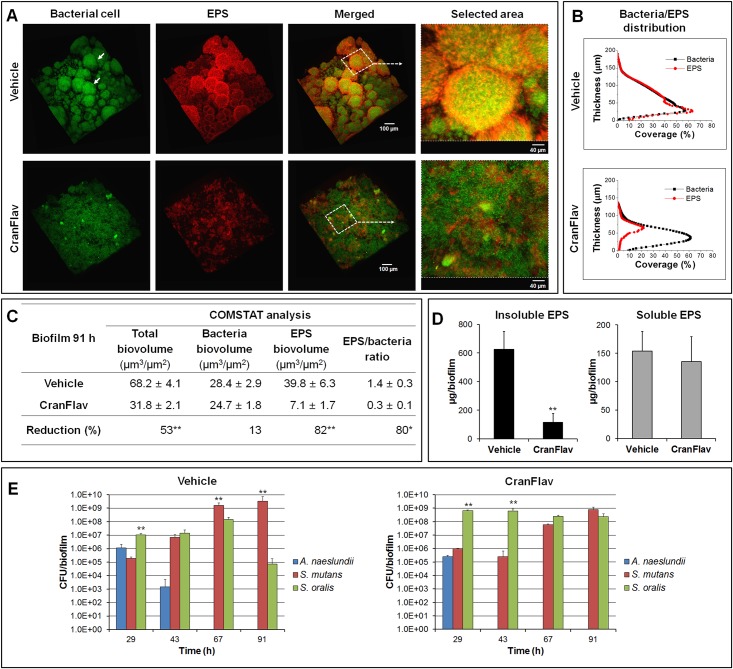
Fig 3. Three-dimensional (3D) architecture, EPS content and microbiological composition of mixed-species biofilms treated with CranFlav.
(A) Representative 3D rendered images of mixed-species biofilms following topical treatments. Selected areas in panel (A) show detailed views of merged confocal images of bacterial cells (green) and EPS (red). (B) COMSTAT analysis of bacterial cells and EPS distribution across biofilm thickness (from the disc surface to the fluid phase interface). (C) Quantitative analysis of confocal images using COMSTAT software for determination of total, bacteria and EPS biomass (as well as EPS/bacteria ratio). The asterisks indicate that total biovolume, EPS biovolume and EPS/bacteria ratio of biofilm treated with CranFlav are significantly different from vehicle-control. A pairwise comparison between vehicle-control and CranFlav was conducted using a t-test. Values are significantly different from each other at *p<0.01 or **p<0.001. (D) Biochemical quantification of water-soluble EPS and insoluble EPS via colorimetric (phenol-sulfuric) assay (n = 6). A pairwise comparison between vehicle and CranFlav was conducted using a t-test. Values are significantly different from each other at **p<0.001. (E) Dynamics of microbial populations changes of mixed-species biofilms as determined by viable cell (colony forming units; CFU) counting (n = 6). A pairwise comparison between S. oralis and S. mutans was conducted. Values are significantly different from each other at **p<0.001.

