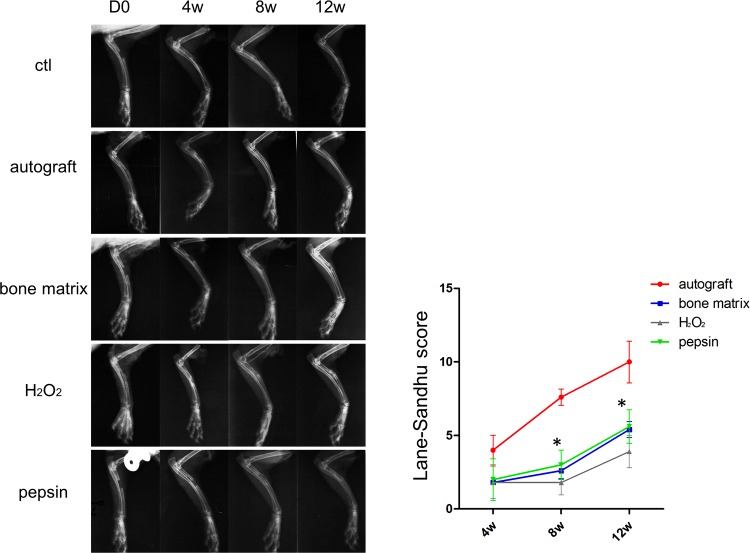
Fig 5. The X-ray analysis showed the osteogensis performance of different graft materials (n = 5).
Different graft materials were implanted in defect sites, the X-ray images were taken 0 day (D 0), 4 weeks (4 w), 8 weeks (8 w) and 12 weeks (12 w) after bone grafting, respectively. The X-ray results were scored by Lane-Sandhu grading method and the statistical data were shown in the right panel. Compared with H2O2, * P < 0.05.

