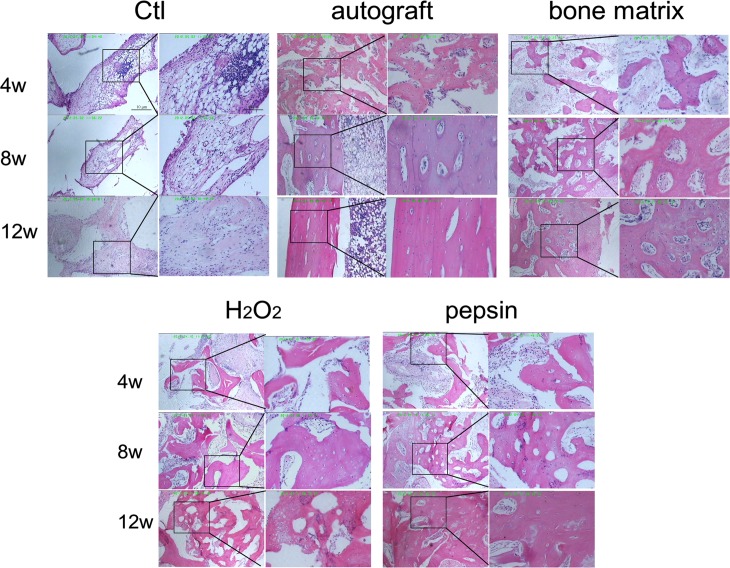
Fig 7. The histological analysis of bones in the defect sites of different groups.
The defect sites of radius in each group were dissected and subjected to HE staining. The pictures on the left side of each group represent the low power microscopic views (40 ×); the magnified views of boxed areas (200 ×) were shown on the right side of each group.

