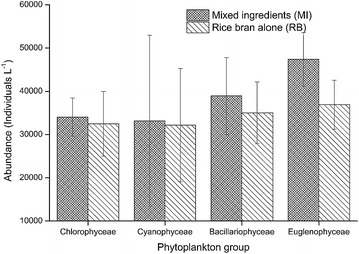
Fig. 2.

Abundance of main phytoplankton groups in Nile tilapia, Oreochromis niloticus ponds fed with mixed ingredients (MI) and rice bran alone (RB) diets. Abundance of each phytoplankton group was not significant different between O. niloticus fed on MI and RB diets (Chlorophyceae, t(8) = 0.175, p = 0.865; Cyanophyceae, t(8) = 0.043, p = 0.967; Bacillariophyceae, t(8) = 0.341, p = 0.742; Euglenophyceae, t(8) = 1.253, p = 0.246; and Dinophyceae t(8) = 0.341, p = 0.742)
