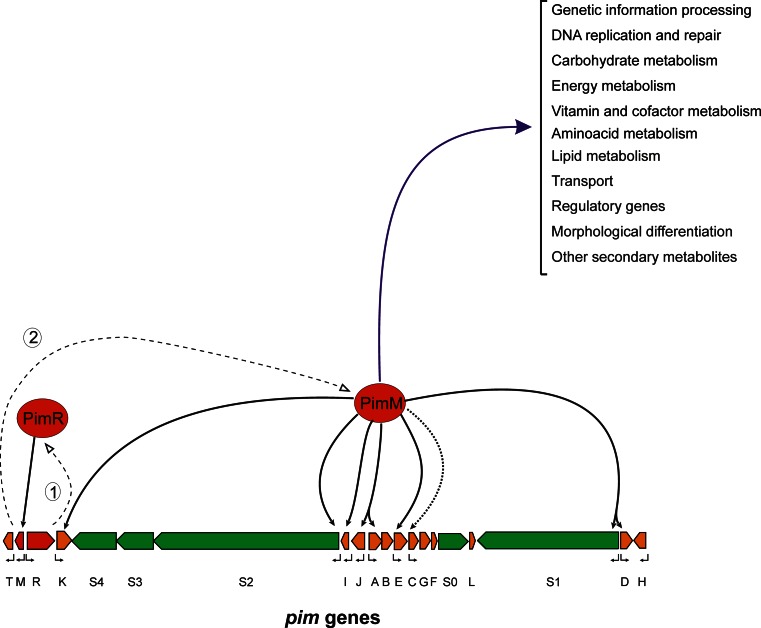
Fig. 5.
Model of PIM regulation. Proposed model for gene expression activation by the cluster-situated regulators pimR and pimM. The pointed boxes indicate the direction of transcription of pim genes. The transcriptional regulators are indicated in red, the PKS genes are shown in green and the remaining genes in orange. Dashed lines represent transcription and translation of regulatory genes. Numbers indicate the order of events. Continuous black arrows indicate direct transcriptional activation, whereas the dotted arrow indicates indirect activation. Bent arrows below the genes indicate transcriptional units. The blue line indicates other processes directly affected by pimM (Vicente et al. 2015)

