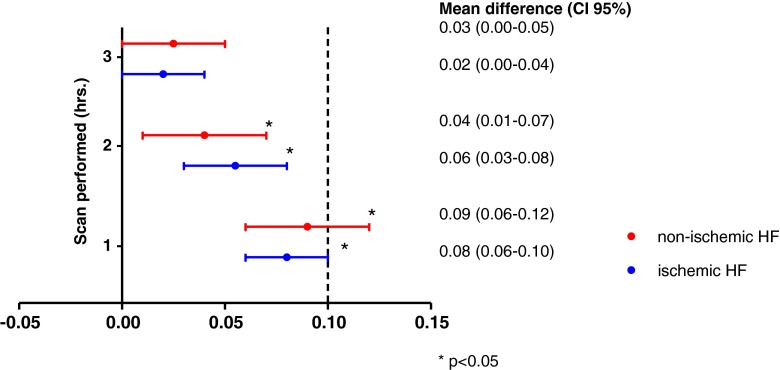
Fig. 3.
Mean differences of the late H/M ratios at 1, 2 and 3 h p.i. in comparison with the late H/M ratio at 4 h p.i. in the ischaemic HF and non-ischaemic HF subgroups. Mean difference with 95 % CI of H/M ratio of late 123I-MIBG images at 1, 2 and 3 h p.i. in comparison with H/M ratio of late 123I-MIBG image at 4 h p.i. analysed with a linear mixed model in the ischaemic HF (blue) and non-ischaemic HF (red) subgroups. A difference in H/M ratio of more than 0.10 between the different acquisition times in comparison with the late H/M ratio at 4 h was considered clinically relevant

