
Figure 1.
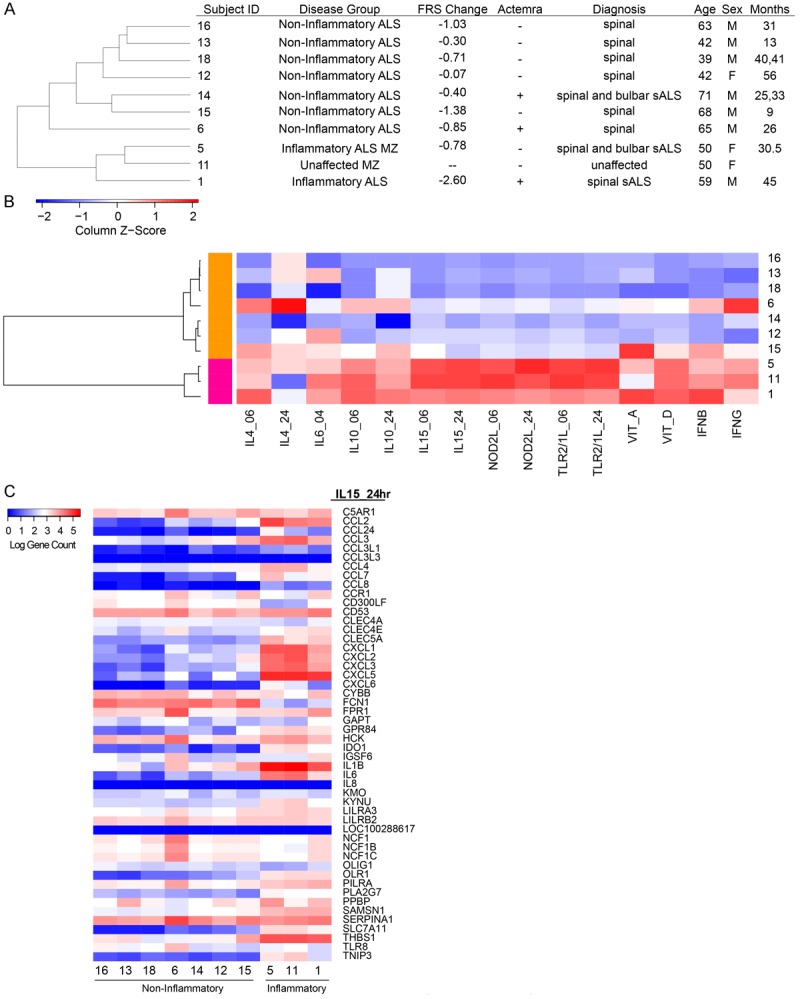
Unsupervised clustering of patient population. A. Patient disease status and demographics ordered by correlation-based cluster of PBMC gene counts. B. Hierarchical clustering dendrogram of ALS blood expression measured by their relative enrichment (Z-score) for immune perturbation signatures across the ALS samples. Unique gene signatures derived from adherent PBMC stimulated by perturbation at 6 h or 24 h as indicated. Each square represents the enrichment score of the top 50 unique genes of a signature (column) for a patient (row) with respect to the other patients, where red indicates a higher enrichment and blue indicates a lower enrichment score of the signature genes. Patients are organized into two main clusters by correlation, where magenta includes inflammatory patients 1, 5 and 11. The orange cluster includes non-inflammatory patients 6, 12, 13, 14, 15, 16 and 18. C. Transcriptional responses of the down-stream genes in the IL-15 pathway. Note downregulation of IL-6 responses but heterogeneity in IL-1beta responses in “non-inflammatory” patients.