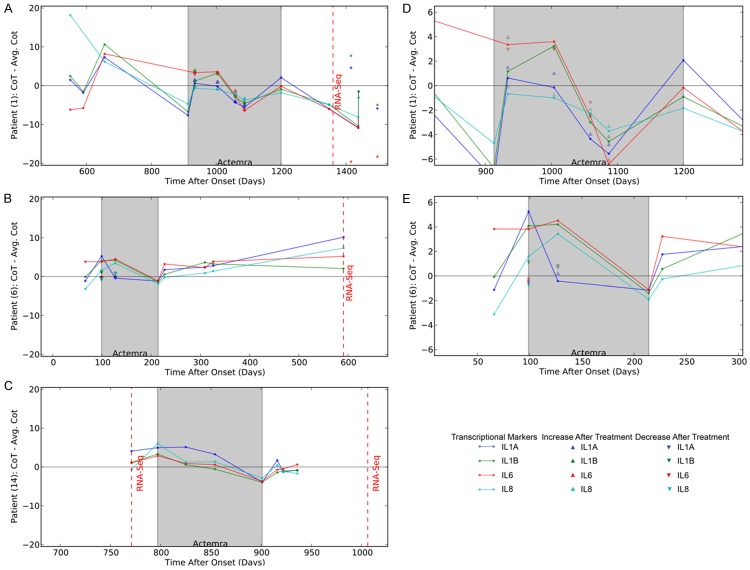
Figure 5.
Longitudinal Course of the Transcription of IL-1alpha, IL-1 beta, IL6 and IL-8 in three ALS patients. A. Longitudinal course of inflammatory patient #1; B. Longitudinal course of a non-inflammatory patient #6; C. Longitudinal course of a “non-inflammatory“ patient #14; D. The rescaled transcriptional response of patient 1 during the Actemra treatment period. E. The rescaled transcriptional response of patient 14 during the Actemra treatment period. The blue dots indicate the difference of the observed IL-1α transcriptional level to the mean IL-1α level. The green dots indicate the difference of the observed IL-1β transcriptional level to the mean IL-1β level. The red dots indicate the difference of the observed IL-6 transcriptional level from the mean IL-6 level. The light blue dots indicate the difference of the observed IL-8 transcriptional level to the mean IL-8 level. All mean transcriptional level was calculated across all samples and days. The grey box indicates the days after onset of ALS in which transcriptional levels were measured after Actemra treatment. The dashed red line indicates the days after onset in which PBMCs were sampled for RNA-Seq analysis. Up arrows indicate the level of a positive (i.e. decreased transcription) immediate response to Actemra for the corresponding transcriptional marker, while down arrows indicate the level of a negative (increased transcription) response to Actemra.

