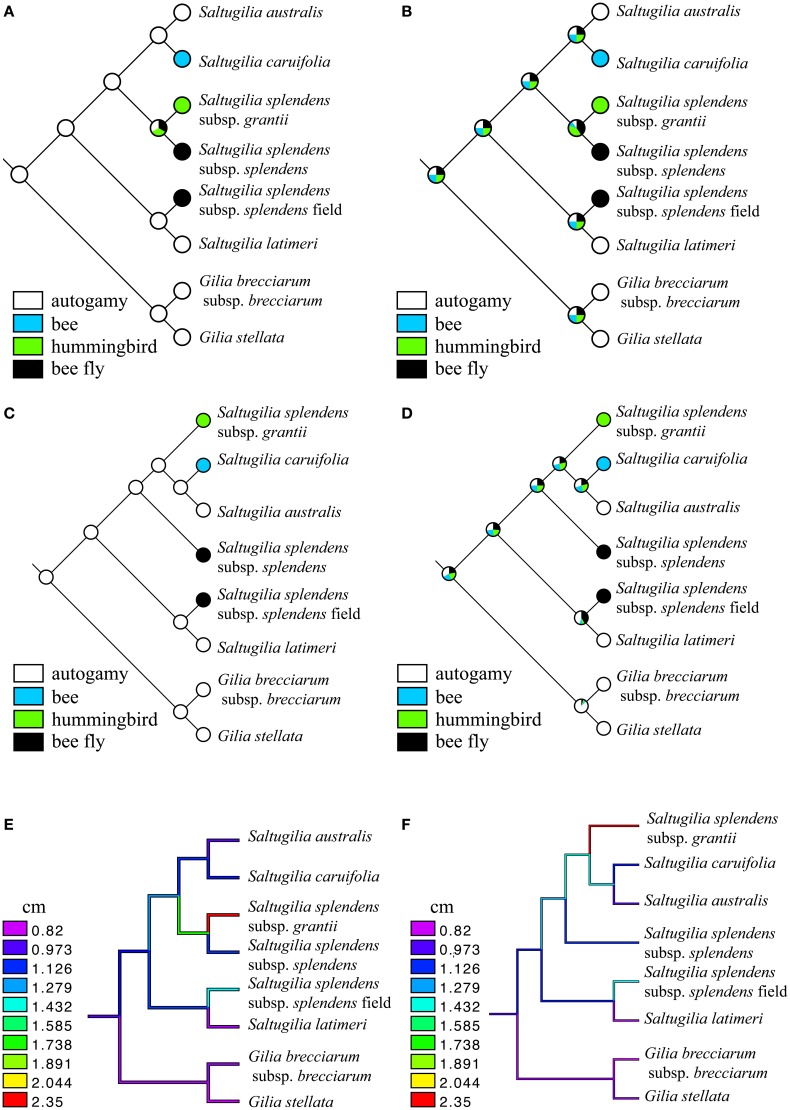
Figure 10.
Ancestral-state reconstructions of pollinators (A–D) and size (E,F) under a maximum parsimony (MP) and maximum-likelihood (ML) framework using the two competing topologies. (A) MP of pollinators using the topology from plastid coding genes, (B) ML of pollinators using the topology from plastid coding genes, (C) MP of pollinators using the topology from the complete plastome and nuclear genes, (D) ML of pollinators using the topology from the complete plastome and nuclear genes, (E) continuous reconstruction of flower size using the topology from plastid coding genes, and (F) continuous reconstruction of flower size using the topology from the complete plastome and nuclear genes.

