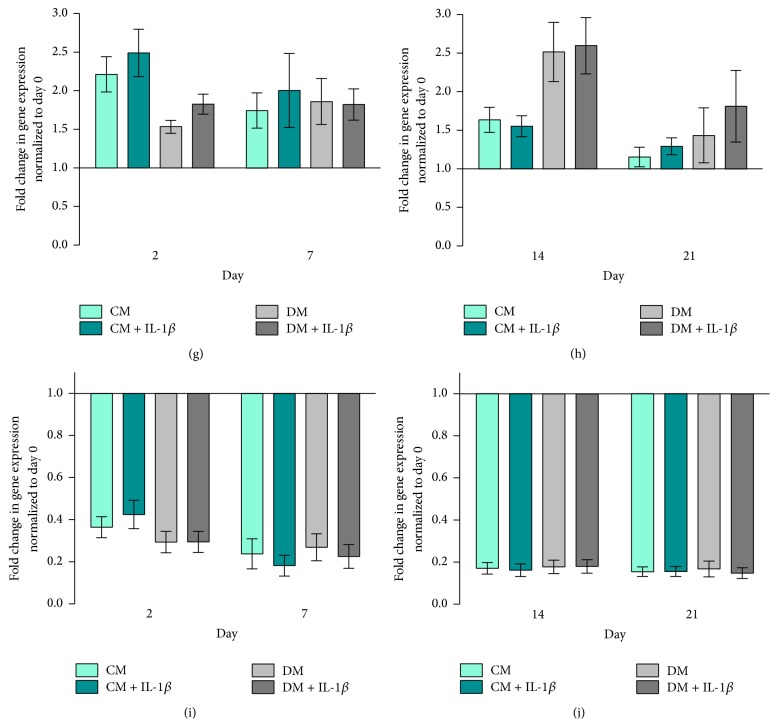
Figure 3.
Runx2/Sox9 ratio hMSCs. Bars show the mean ± SEM of 3 different experiments performed in triplicate per group based on fold change in gene expression normalized to day 0 (n = 3 per group); one-way ANOVA was used to test for statistical significance. (a) Runx2/Sox9 ratio on days 2 and 7, (b) Runx2/Sox9 ratio on days 14 and 21 (mind the gap in the y-axis).

