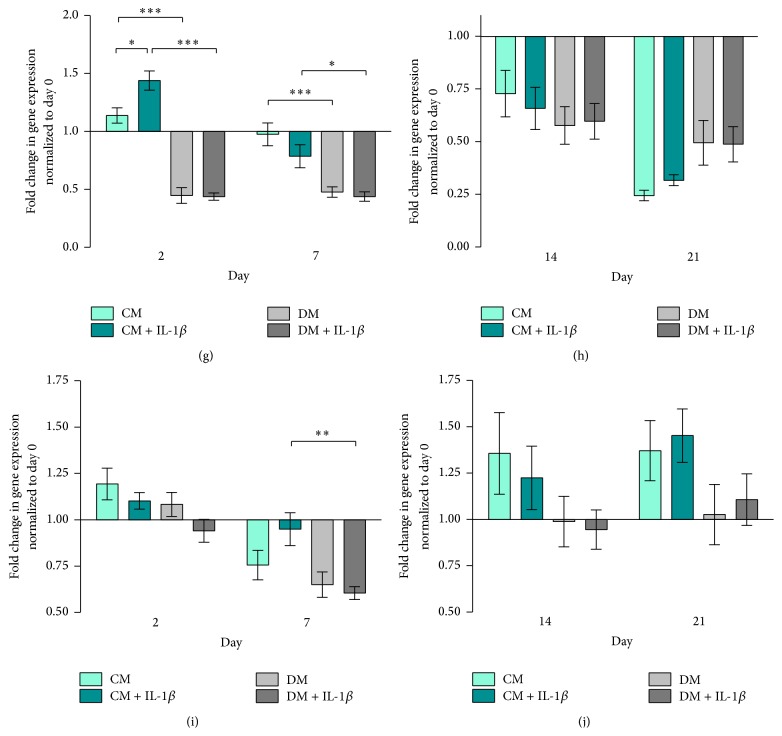
Figure 6.
DNA quantification. Total DNA content expressed in μg/mL. Bars show the mean ± SEM of 3 different experiments performed in triplicate per group. D'Agostino-Pearson omnibus normality test was used, followed by one-way ANOVA; ∗ p ≤ 0.05; ∗∗ p ≤ 0.01; ∗∗∗ p ≤ 0.001. (a) Total DNA content in hMSC culture on days 14, 21, and 28 (n = 9 per group). (b) Total DNA content in MG63-GFP cell culture on days 14, 21, and 28 (n = 9 per group).

