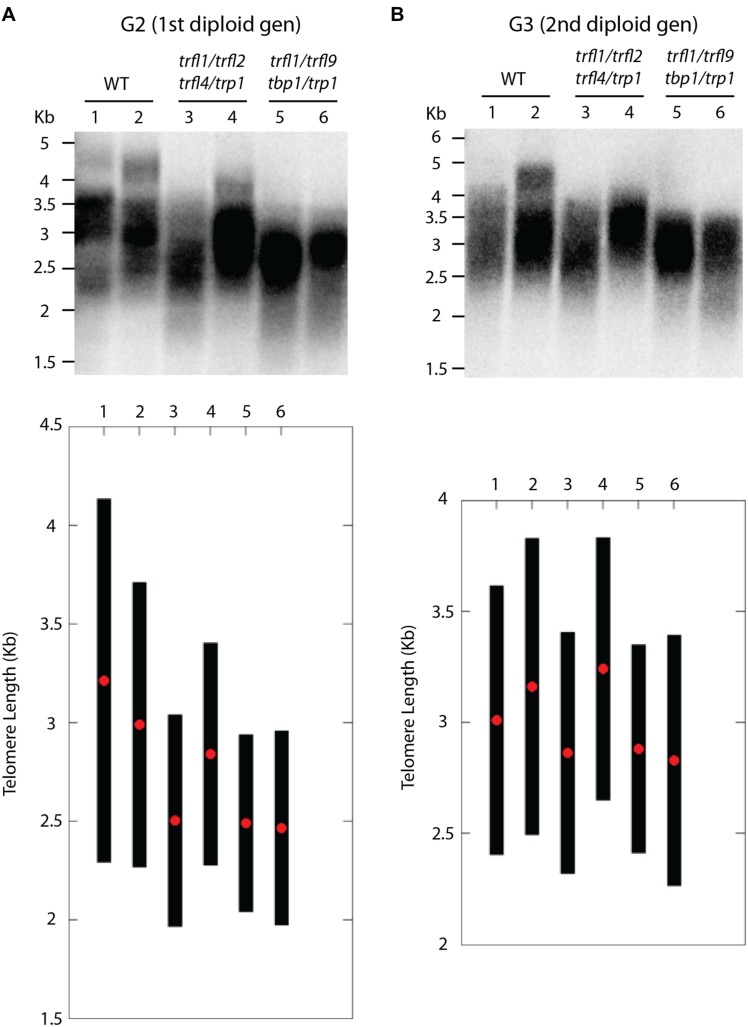
FIGURE 4.
Telomere length analysis of quadruple trfl1 trfl2 trfl4 trp1 and trfl1 trfl9 tbp1 trp1 mutants. TRF blots show telomere lengths from second generation (A) and third generation (B) plants along with WT controls. Blots from the Second generation show TRF profiles of two individual doubled haploid plants. DNA was pooled from 5 plants in the next generation and subject to TRF analysis in the third generation. Corresponding lanes of both blots represent plants of the same lineage. Graphs plotted from TeloTool analysis are shown below respective blots. Red dots represent the extracted mean and black bars show calculated range values.

