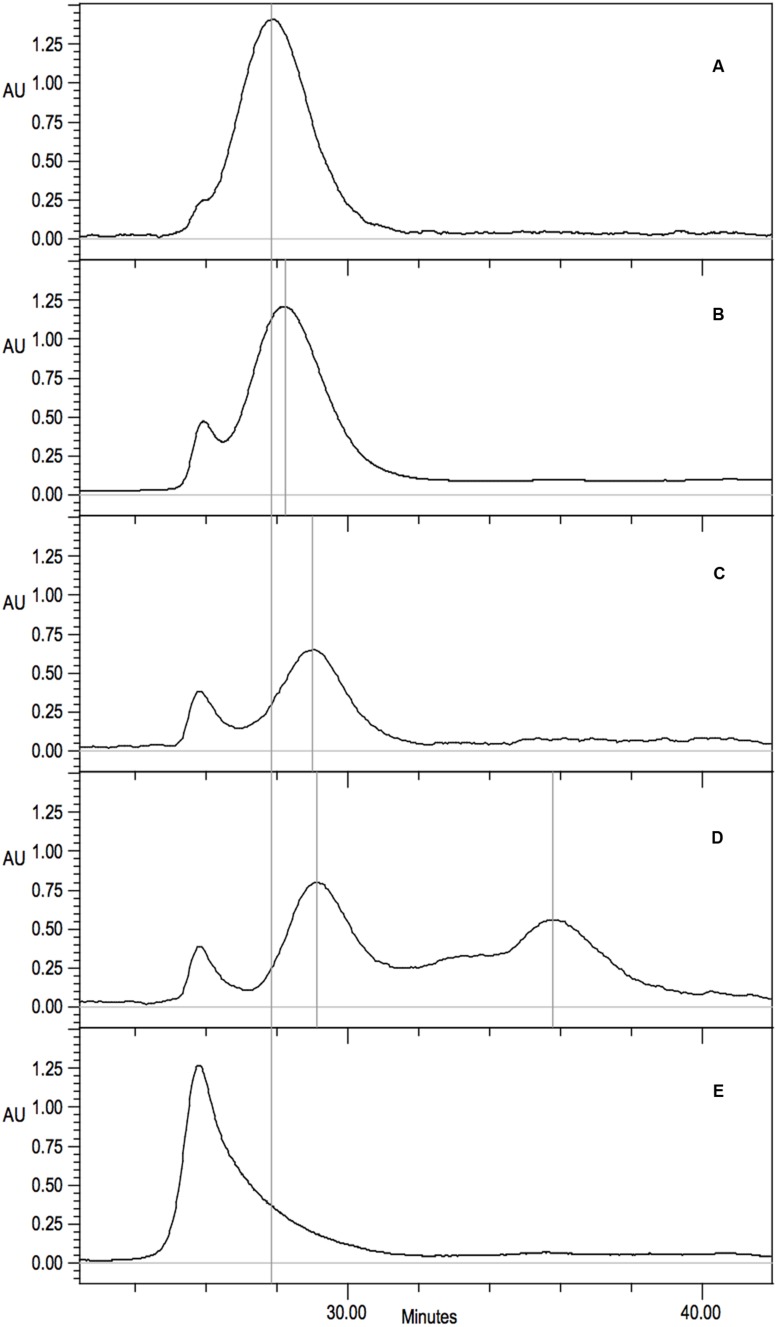
FIGURE 6.
Gel filtration analysis on Superdex 200 10/300 GL of purified CynD protein in 100 mM MOPS pH 7.7. Elution monitored as absorbance at 220 nm. Vertical gray lines highlight prominent peaks. Continuous black line indicates wild-type CynD elution peak. Representative elution patterns of substitution mutants in CynD; (A) wild type 18-mer CynD, (B) intermediate 16-mer mutants (F69C shown) (see Table 2), (C) P. stutzeri CynD 14-mer-like F57C, (D) multiple elution peaks of R67C (also see Figure 6A), (E) sloping void peak of Q228C.

