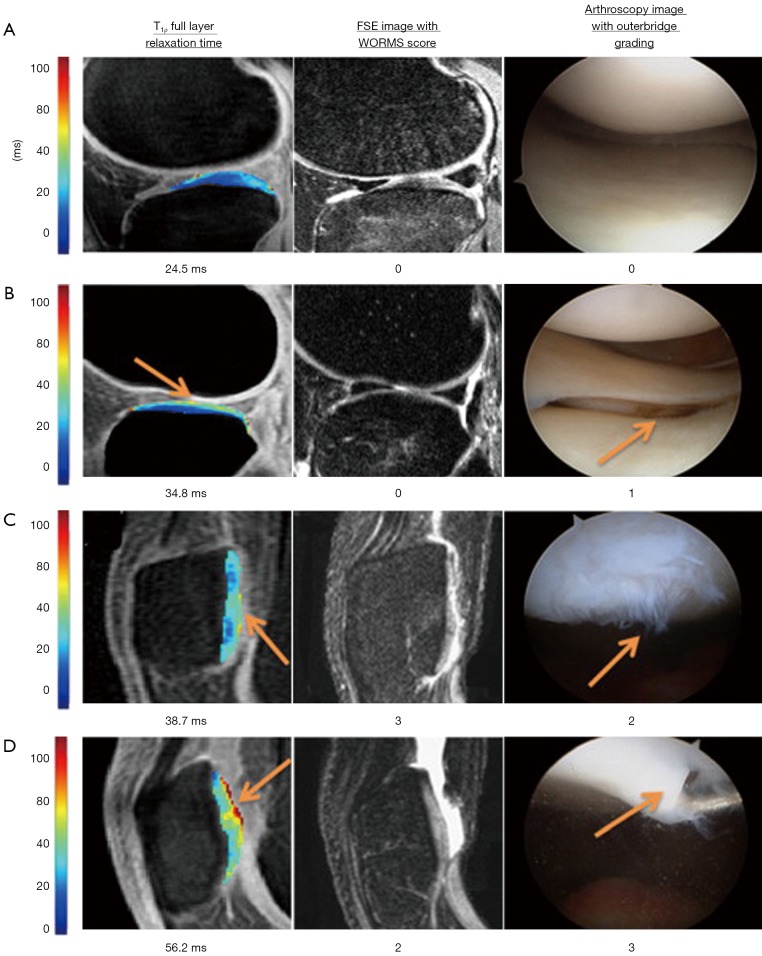
Figure 8.
Color maps of T1ρ relaxation times alongside registered FSE images and arthroscopy images of the same region. Increased T1ρ relaxation times are observed in conjunction with the increased Outer bridge grading of 0 to 3. Elevated T1ρ values were observed in regions with arthroscopically confirmed focal lesions (as indicated by arrows) [Reprinted with permission (86)]. FSE, Fast Spin Echo.

