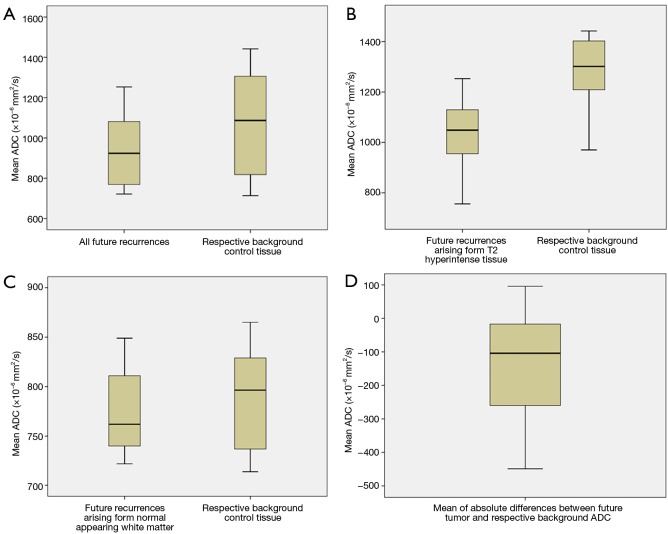
Figure 4.
Box and whisker plots demonstrate the differences between mean ADC in sites of future tumor recurrence and respective background tissue in (A) all future recurrences vs. respective background n=20; (B) future recurrence arising from T2 hyperintense tissue vs. background T2 hyperintensity n=12; (C) future recurrence arising from normal appearing WM shown); (D) mean of absolute differences in ADC between future tumor sites and respective background ADC. Note that the large overlap in ADC values seen with the whole group analysis is lessened when only recurrence arising from T2 hyperintense tissue is evaluated. ADC, apparent diffusion coefficient; WM, white matter.

