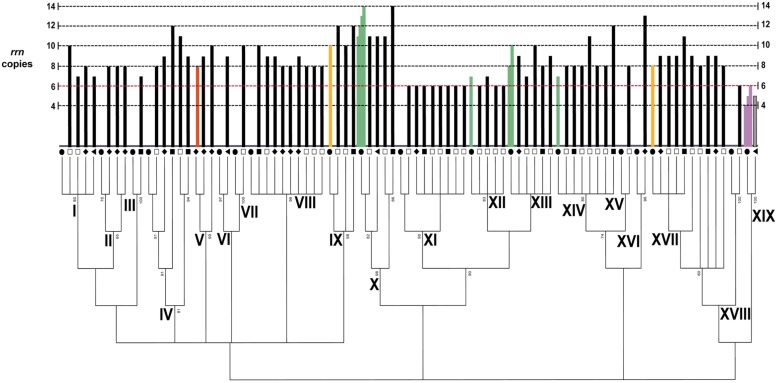
FIGURE 2.
Variability of the rRNA operon copy number in the Bacillus diversity from the CCB. ML tree of the 5′ HV region of the 16S rDNA with a 50% of cut-off value. The black circles represent the type strain of Bacillus for every phylogenetic group. The squares, triangles and rhomboids symbols correspond to the environment as described in Figure 1. The dotted red line represents the low number of the rrn operon in Bacillus according to the rrnDB. The black bars represent the number of operon copies in the isolates from the CCB, and the green bars represent the number of copies in Bacillus species reported in the rrnDB. Gray bar represents the number of copies in the isolate related to the genus Staphylococcus. The light purple bars represent the number of operon copies in different Staphylococcus species analyzed by the rrnDB. The orange bar represents the number of copies quantified in the type strain of B. coahuilensis (m4-4 = NRRL B-41737T), group V. The yellow bars represent the number of copies in the type strains of B. marisflavi (JCM 11544 = KCCM 41588) and B. horikoshii (ATTCC 700161), groups IX and XVII, respectively.

