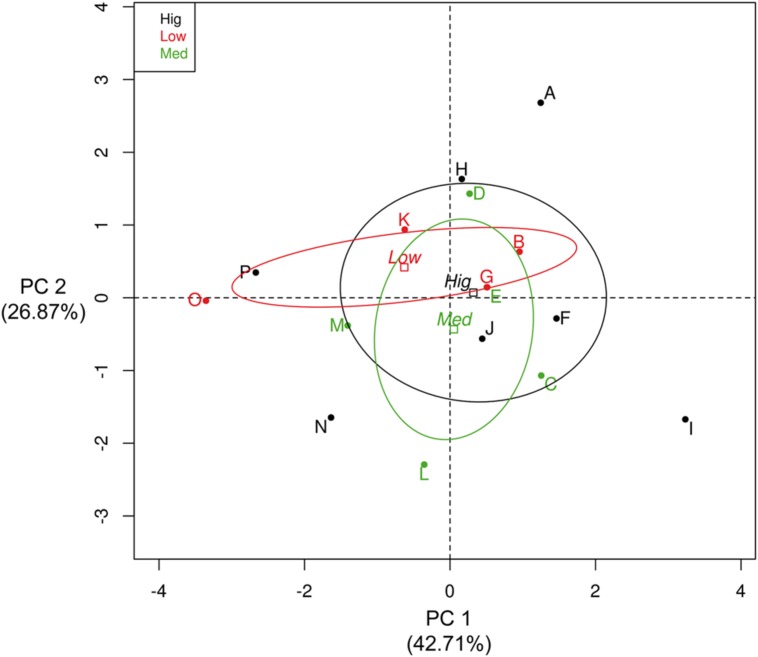
FIGURE 3.
Principal component analysis (PCA) of the growth parameters estimated in the Bacillus isolates from the CCB. The names of isolates (letters, from A to P) were in agreement with the maximum biomass reached (A) in Table 1. Color labels represent the isolates of the arbitrary categorization of the number of copies of the rrn operon (upper left box), where red labels are the isolates with “low copy numbers” (five to seven), green labels are the isolates with “intermediate copy numbers” (8 to 10) and black labels are the isolates with “high copy numbers” (from 11 to 14).

