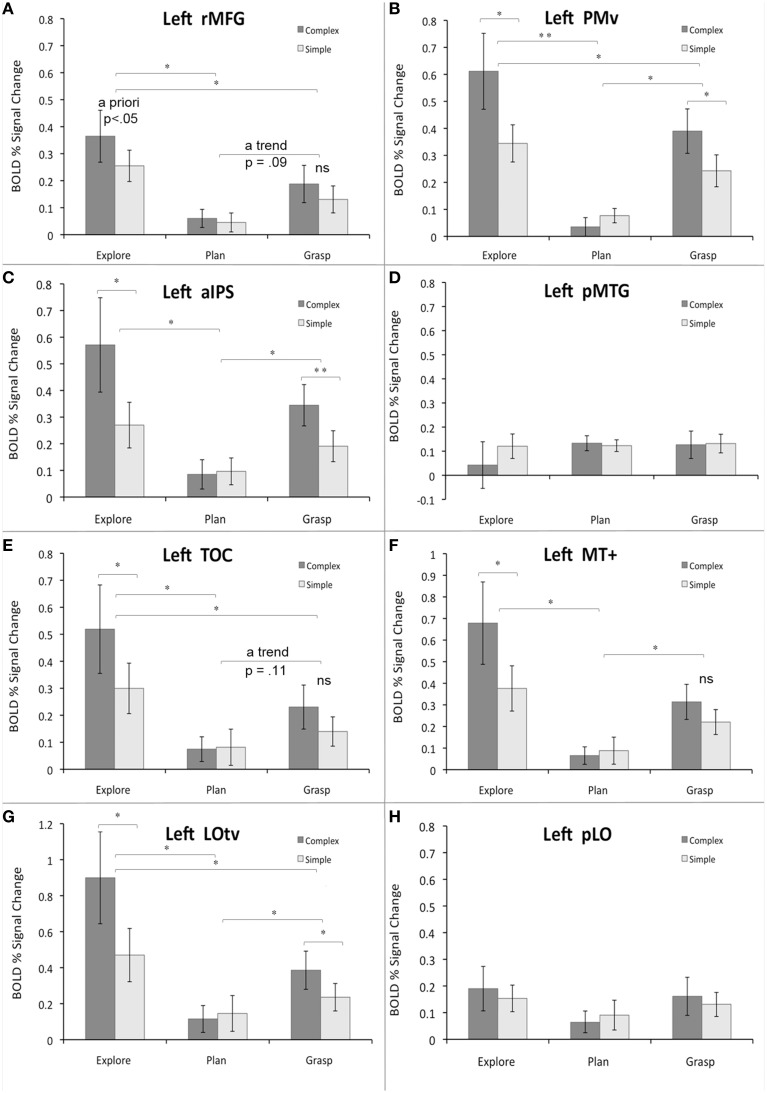
Figure 5.
Region-of-interest analyses for critical areas identified with different contrasts from the main study and/or localizer scans. Panels (A–H) refer to specific ROIs. See main text for details. The average percent signal change within each ROI is plotted relative to resting baseline activity for the three major study phases or tasks (exploration, planning, grasping), and two object types (complex, simple). The significant main effects and simple main effects (from the significant interactions) are shown. Error bars reflect the within-subjects standard error of the mean (SEM). Asterisks indicate all the significant differences with the Bonferroni-corrected P-values of at least 0.05 (*) or 0.01 (**); “ns” indicates substantial but not significant differences.

