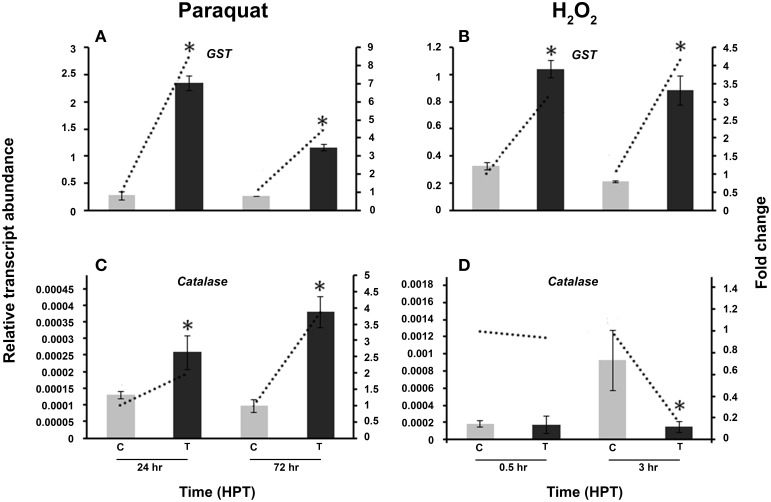
Figure 8.
Effect of abiotic stress on R. solani AG3 glutathione S-Transferase (GST) and catalase genes. Regulation of R. solani AG3 GST (A,B), and catalase (C,D) transcripts when grown in PDB amended with paraquat (4 mM) (A,C) or hydrogen peroxide (H2O2) (5 mM) (B,D). The relative transcript abundance of gene expression was normalized with G3PDH. C, control; R. solani grown without stress inducers. T, treatment with stress inducer. HPT, hours post treatment. Asterisk indicates significant relative transcript abundance between the control and interaction of each time point using Least Significant Difference test (P < 0.05). Bars represent the average relative transcript abundance of three biological replicates ± standard deviation. Dotted line represents fold change which was calculated by normalization of treatment samples with appropriate controls at each corresponding time point.

