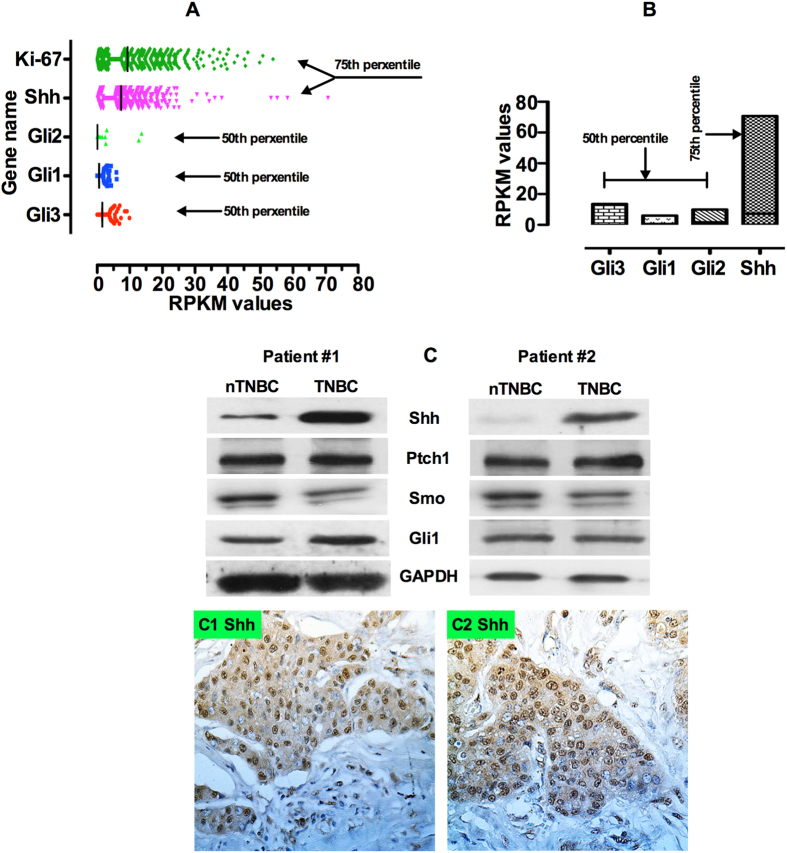
Figure 4. Shh RNA expression in the whole genome in the breast cancers using RNA-Seq library data from a TCGA dataset on 881 patients.
(A) The figure shows that Shh is highly expressed; Gli1, Gli2 and Gli3 show a moderate or low level of expression for each gene. (B) Expression associations between Shh and Gli1, Gli2 and Gli3. (C) [Top pane; left and right panel] Western blot analysis results on Shh from two representative triple negative breast cancer patients showing expression intensities of Shh, Ptch1, Smo and Gli1. [Bottom panel; left and right panel] Representative immunostaining from two TNBC patients. To quantify the Shh expression (X40 magnification) levels in five random areas within each tumor were determined.

