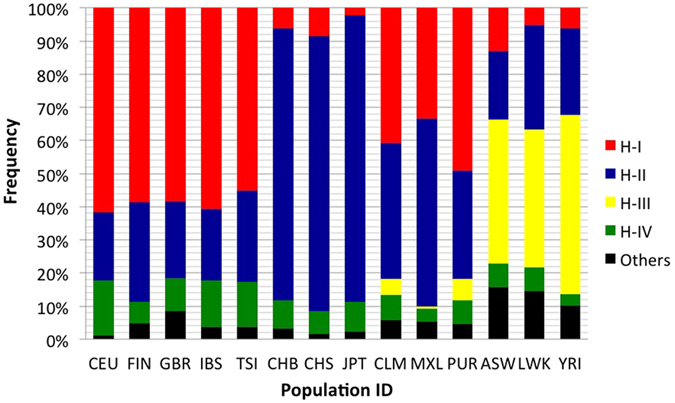
Figure 2. A comparison of GATM haplotype distribution among various populations.

Three GWAS and three non-synonymous SNPs and 20 SNPs with top  values were selected for haplotype construction and comparison.

Three GWAS and three non-synonymous SNPs and 20 SNPs with top  values were selected for haplotype construction and comparison.