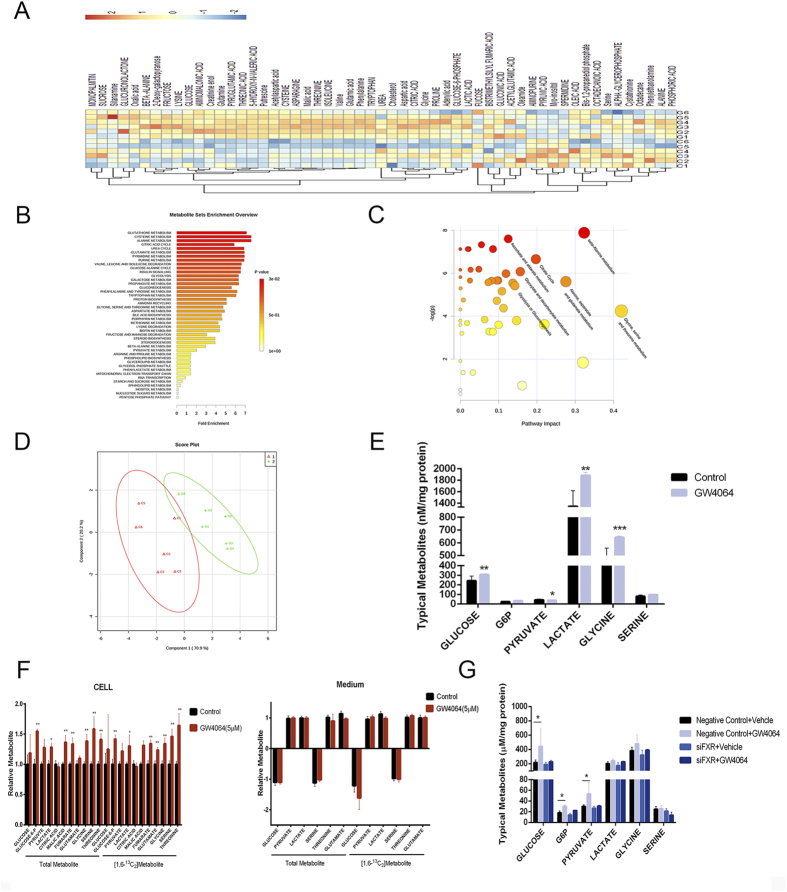
Figure 2. Activation of FXR triggers metabolic reprogramming.
(A) Heatmaps of HepG2 cells treated with GW4064. Control Group, C1 to C6; GW4064-treated Group, G1 to G6. (B,C) The impact of GW4064 on HepG2 cell metabolic pathways. Intracellular metabolite-based metabolic pathway analysis of HepG2 cells (B) Overview of metabolites that were enriched in HepG2 cells based on HepG2 cell intracellular metabolites (C). (D) PLS-DA scoring plot based on GC/MS metabolic profiles (R2X = 0.722; R2Y = 0.852; Q2Y = 0.738). (E) Concentrations of major intracellular intermediates in glycolysis pathway in HepG2 cells. (F) Relative metabolite abundance in HepG2 cells grown in [1, 6-13C2]-glucose upon treatment of GW4064. Data are presented as the total metabolite pool and the 13C-labelled and Glc-derived metabolite pool (right). (G) Concentrations of major intracellular intermediates in glycolysis pathway in HepG2 cells when treated with FXR siRNA with or without the combined treatment of GW4064. Values are presented with mean ± SD (n = 6; *P < 0.05; **P < 0.01; ***P < 0.001).

