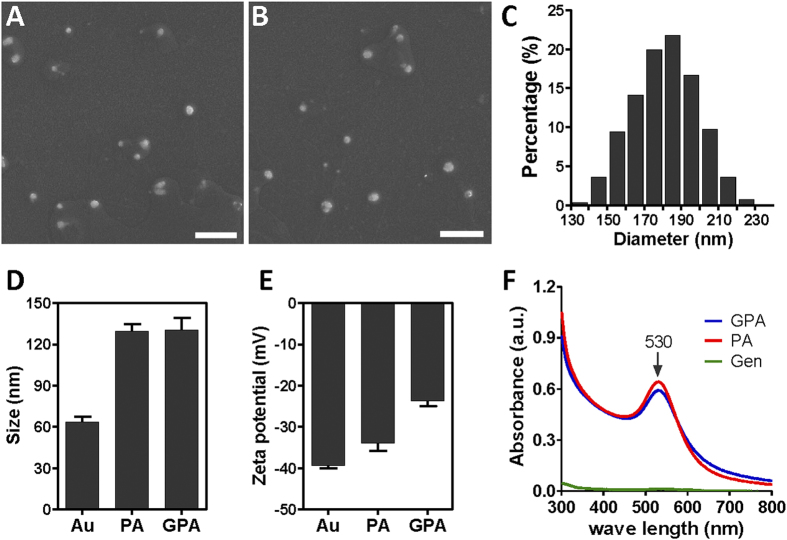
Figure 1.
SEM image of PA NPs (A) and GPA NPs (B); (C) size distribution of GPA estimated using Image J (about 1000 particles were counted); (D) Hydrodynamic size and (E) surface zeta potential of bare Au NPs, PA NPs and GPA NPs measured by dynamic light scattering; (F) absorption spectrum of PA NPs, GPA NPs and gentamicin.Scale bar represented 1 μm.

