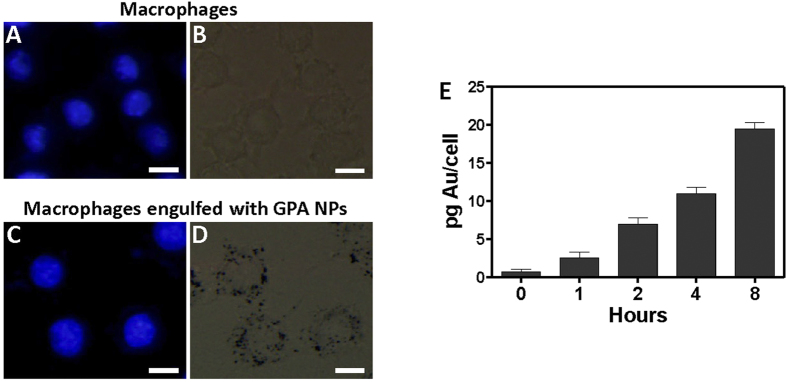
Figure 6. Fluorescence image (A,C) and brightfield image (B,D) of macrophages alone, or macrophages incubated with GPA NPs for 2 h followed by rinsing with new medium.
Scale bar represented 10 μm. (E) Cellular uptake of GPA NPs measured by ICP-MS. RAW264.7 cells were incubated in the presence of 0.116 mg/mL of GPA NPs as time indicated. Data are represented as pg Au/cell.

