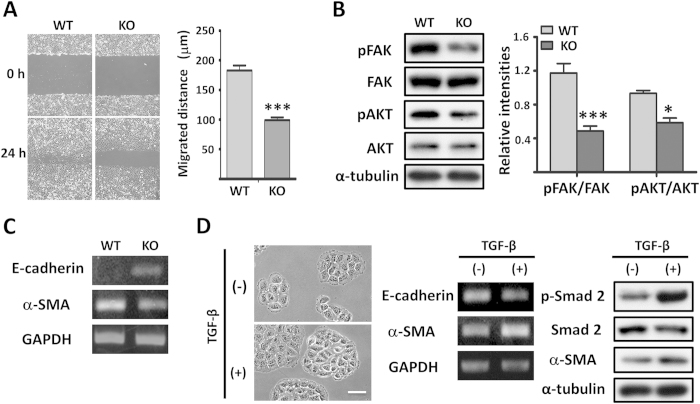
Figure 2. β1 was essential for malignant phenotype reversion and FAK/AKT signaling.
(A) Cells were cultured until reaching more than 90% confluence. A scratch was made with a pipet in each well, and was photographed at 0 h and 24 h (left panel). Quantification of cell migrated distances are expressed as the means ± s.e.m from three independent experiments (***p < 0.001 by two-tail unpaired t-test) (right panel). (B) Cell lysates from WT and KO cells were immunoblotted by anti-pFAK, anti-FAK, anti-pAKT and anti-AKT antibodies. α-Tubulin was used as a loading control. The quantitative data are presented as the means ± s.e.m from three independent experiments (*p < 0.05, ***p < 0.001 by two-tail unpaired t-test). (C) RT-PCR analysis using total RNA extracted from WT and KO cells was carried out to examine the expression levels of E-cadherin and α-SMA. The expression level of GAPDH was used as a loading control. (D) Images of β1-KO cells that were untreated or stimulated with TGF-β for 48 h. Scale bar represents 50 μm (left panel). RT-PCR using total RNA extracted from indicated cells was carried out to detect the expression levels of E-cadherin and α-SMA. GAPDH was used as a loading control (middle panel). Representative western blots corresponding to the expression of pSmad2, Smad2 and α-SMA in TGF-β treated and untreated β1-KO cells, α-tubulin was used as a loading control (right panel).

