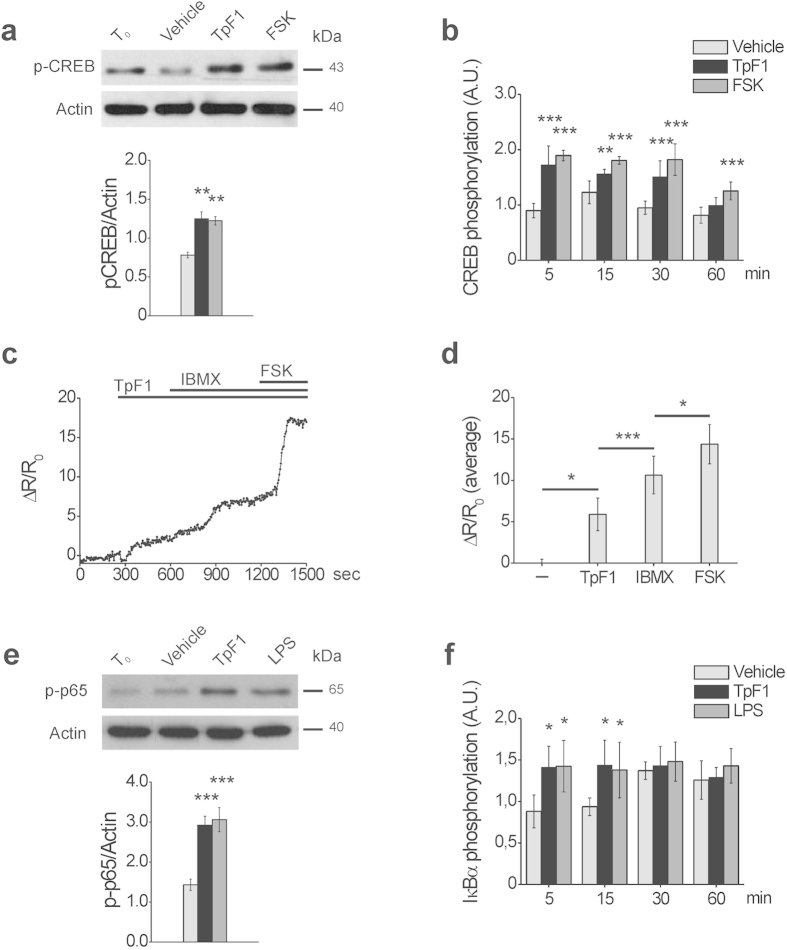
Figure 4. TpF1 activates CREB and NF-κB in endothelial cells.
(a) HUVECs were exposed to TpF1, forskolin or vehicle (saline). After 30 min, cells were processed for western blot and phospho-CREB and actin were revealed with specific antibodies. The graph shows the ratio between phospho-CREB and actin (n = 4). **p < 0.01. (b) HUVECs were exposed to TpF1, forskolin or vehicle. At the indicated time points, the phosphorylation of CREB was evaluated by ELISA assay. For each sample, data were normalized to the total CREB protein. Normalized fluorescence value of cells at time 0 (T0) was taken as reference and set as 1 A.U. and CREB phosphorylation of treated cells was expressed as fold change of T0 cells. Data are expressed as mean ± S.D. of three independent experiments. Significance was determined by Student’s t-test for data of agonist-treated cells versus vehicle-exposed cells. **p < 0.01; ***p < 0.001. (c) Representative kinetics of cAMP changes recorded in a Epac1-expressing HUVEC, upon addition of 20 μg/ml TpF1, followed by 100 μM IBMX and by 25 μg/ml forskolin. cAMP variations are presented as ΔR/R0. The average ΔR/R0 increases (mean ± S.E.M., n = 9) are presented in (d). *p < 0.05; ***p < 0.001. (e) HUVECs were exposed to TpF1, LPS or vehicle. After 30 min, cells were processed for western blot. Phospho-p65 and actin were revealed with specific antibodies. The graph shows the ratio between phospho-p65 and actin (n = 4). ***p < 0.001. (f) HUVECs were exposed to TpF1, LPS or vehicle. At the indicated time points the phosphorylation of IkB-α was evaluated by ELISA. For each sample, data were normalized to the GAPDH protein. Normalized fluorescence value of cells at time 0 (T0) was taken as reference and set as 1 A.U. and IkB-α phosphorylation of treated cells was expressed as fold change of T0 cells. Data are expressed as mean ± S.D. of three independent experiments. Significance was determined by Student’s t-test for data of agonist-treated cells versus vehicle-exposed cells. *p < 0.05.

