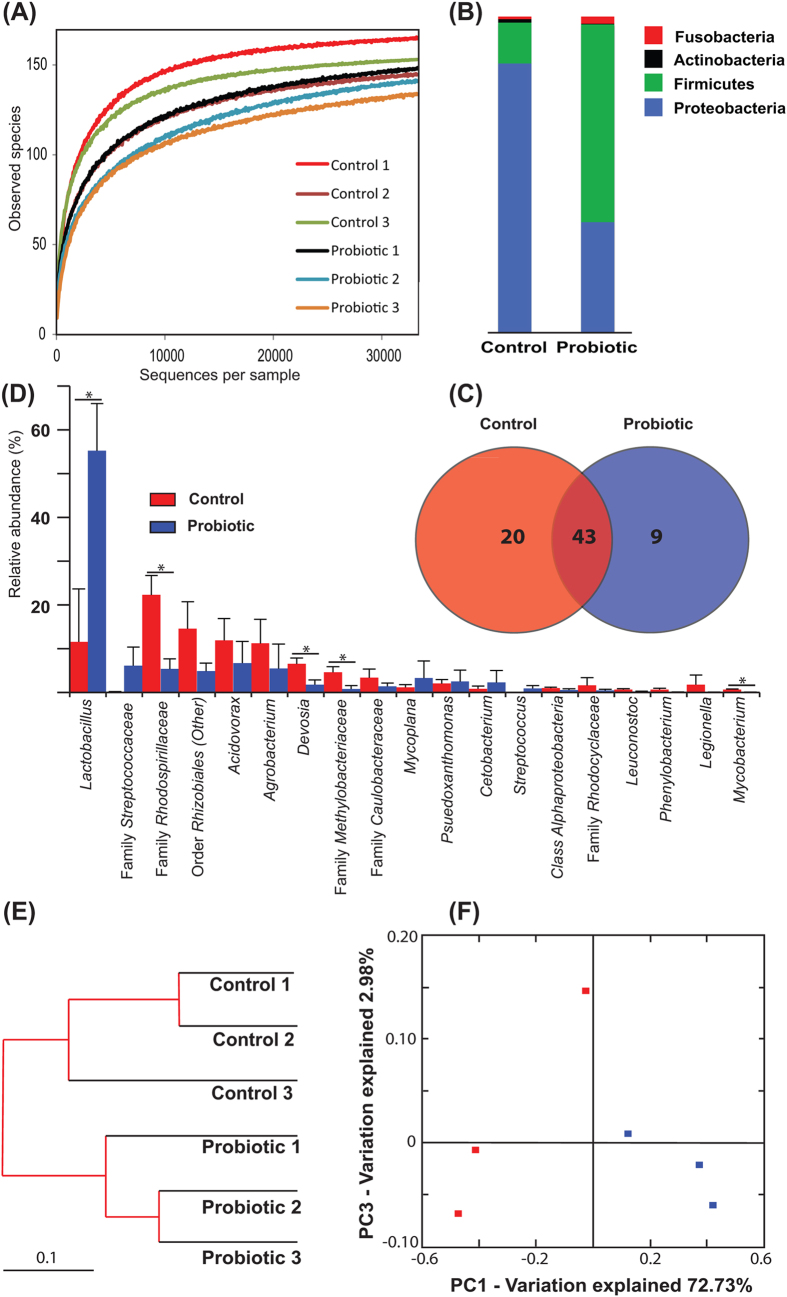
Figure 1. Gastrointestinal bacterial community analysis of 8 dpf zebrafish larvae.
(A) Alpha rarefaction plot of observed species. Relative abundance of reads at the phylum (B) and genera (C) level (taxa accounting for >0.5% are represented). (D) Venn diagram showing the distribution of OTUs (those with >0.01% relative abundance are represented) revealing a shared community consisting of 43 OTUs. Cluster using Bray-Curtis metrics (E) and 2D Principal coordinate analysis (PCoA) plot of weighted UniFrac distances (F). *P < 0.05.

