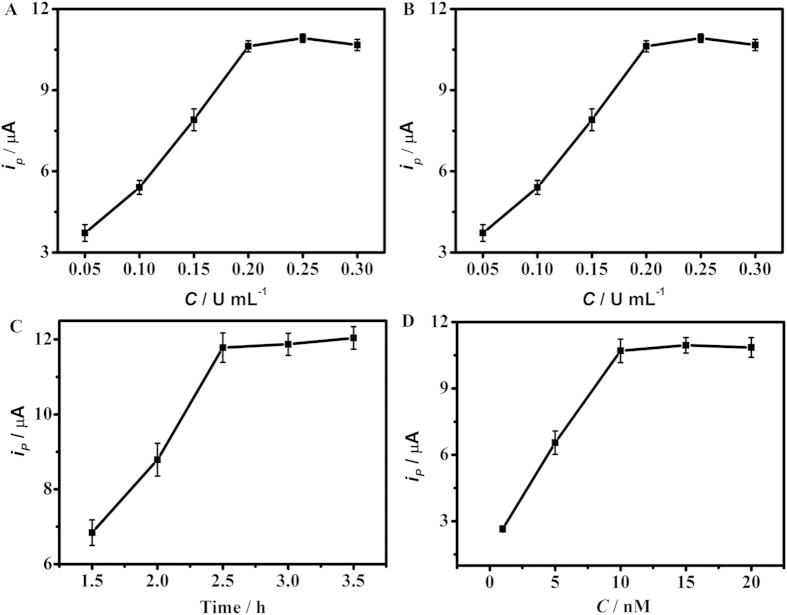
Figure 4. Dependences of DPV peak currents responding to 100 pM target DNA on (A) KF exo- concentration, (B) T7 RNA polymerase concentration, (C) HTITA reaction time and (D) detection probe concentration.
When one parameter changed the others were under their optimal conditions. The error bars represent the standard deviations in three different measurements for each concentration.

