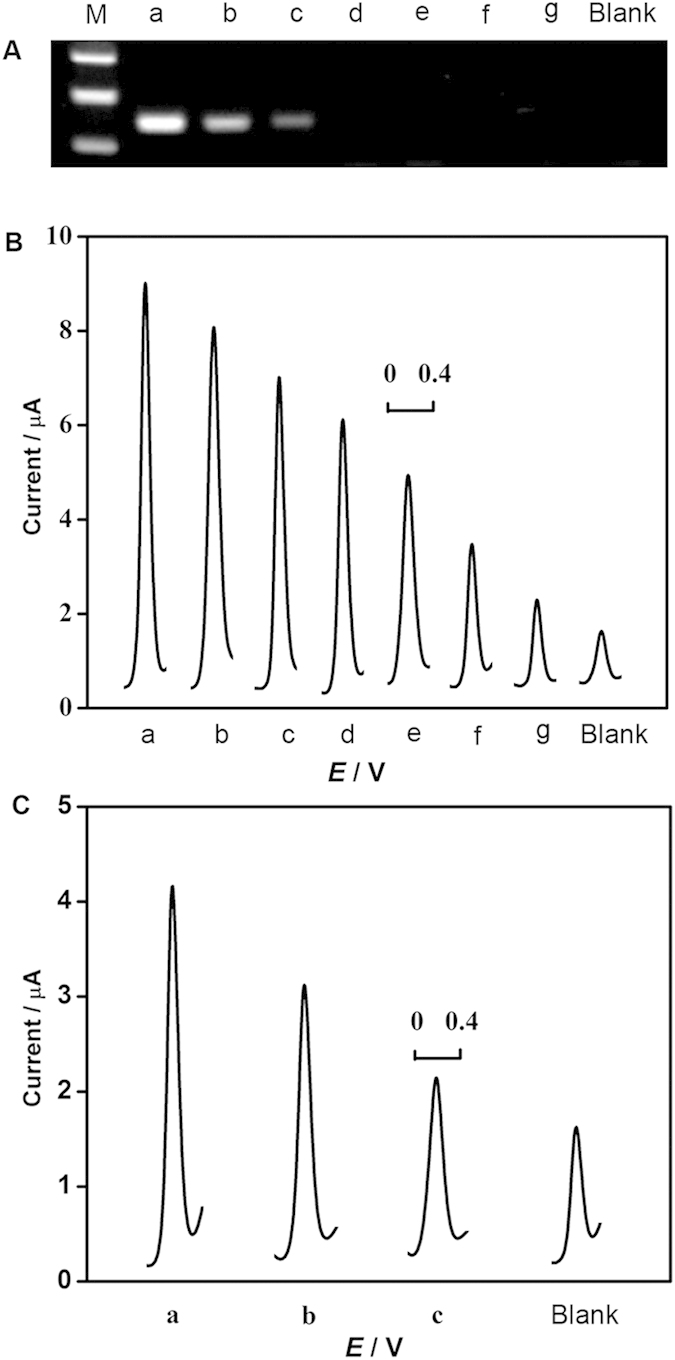
Figure 6.

(A) Gel electrophoresis photos and (B) typical DPV curves of PCR products obtained from 107, 106, 105, 104, 103, 102, 101 CFU mL−1 of Salmonella (from a to g) and blank, respectively. (C) Typical DPV curves for direct detection invA gene from genomic DNA extracts of 107 (a), 106 (b) and 105 (c) CFU mL−1 of Salmonella and blank.
