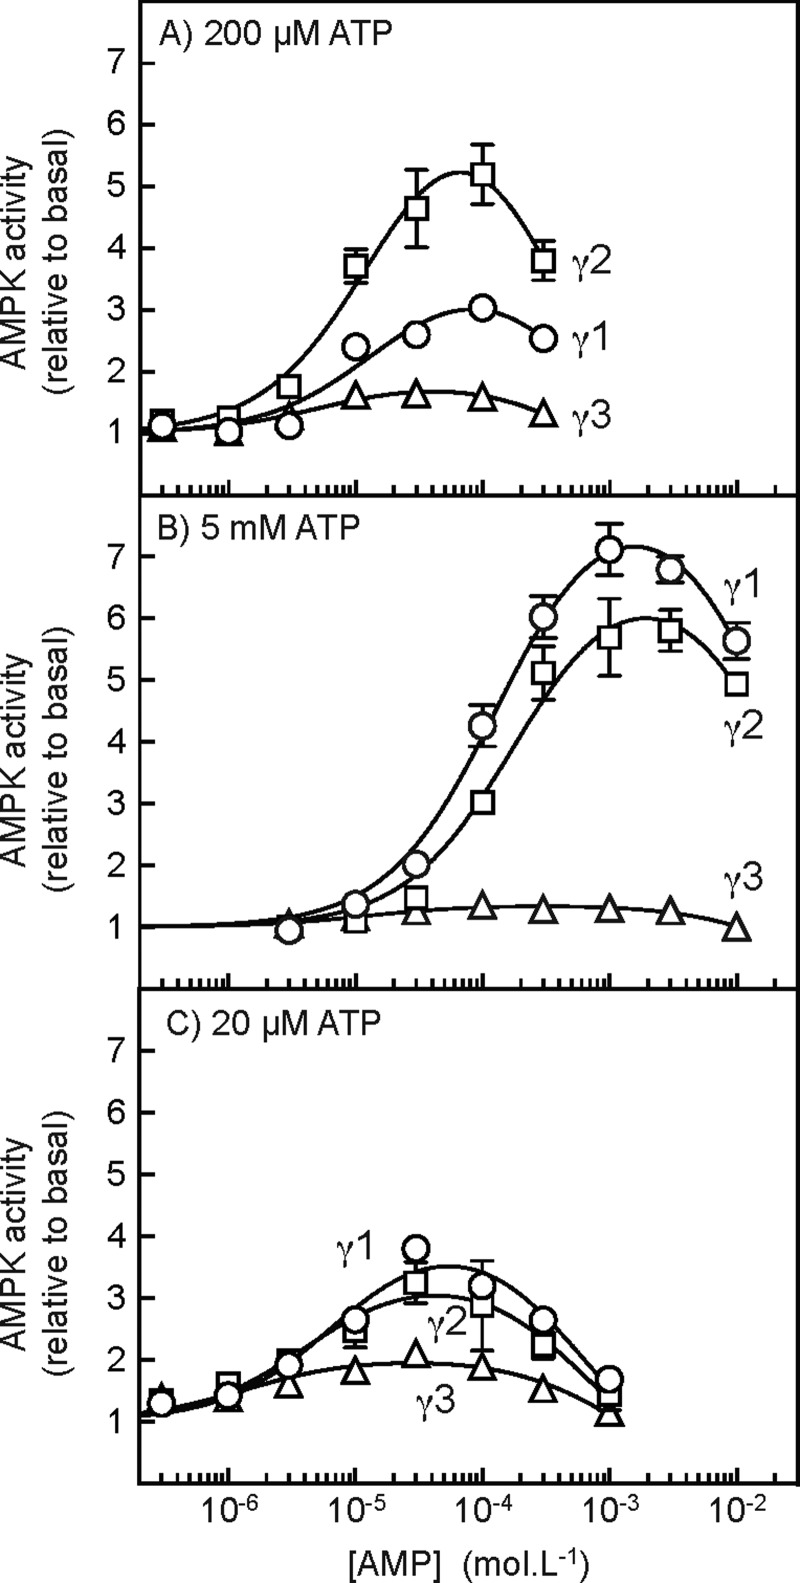
Figure 3. Allosteric activation of AMPK-γ isoforms at different concentrations of ATP.
Cells expressing FLAG–γ1,–γ2 or–γ3 were treated with 10 mM phenformin for 60 min to activate AMPK and the different complexes were immunoprecipitated using anti-FLAG antibody. Kinase assays were conducted at the indicated concentrations of AMP, but with ATP at 200 μM (A), 5 mM (B) or 20 μM (C). MgCl2 was also present at a concentration 4.8 mM higher than ATP; this protocol results in the proportions present as free ATP and as the MgATP2− complex remaining approximately constant [55]. Results (means ± S.E.M., n=3) are expressed relative to the basal activity without AMP and were fitted to the equation: Y=1+{[(activation–1) × X]/(EC50+X)}–{[(activation) × X]/(IC50+X)}, where Y is the activity, X is the concentration of AMP, activation is the predicted maximal activation for the activating phase of the curve, EC50 is the concentration of AMP causing half-maximal activation, and IC50 is the concentration of AMP causing half-maximal inhibition. The continuous lines are the curves generated by this equation using the values for activation, EC50 and IC50 quoted in the text.

