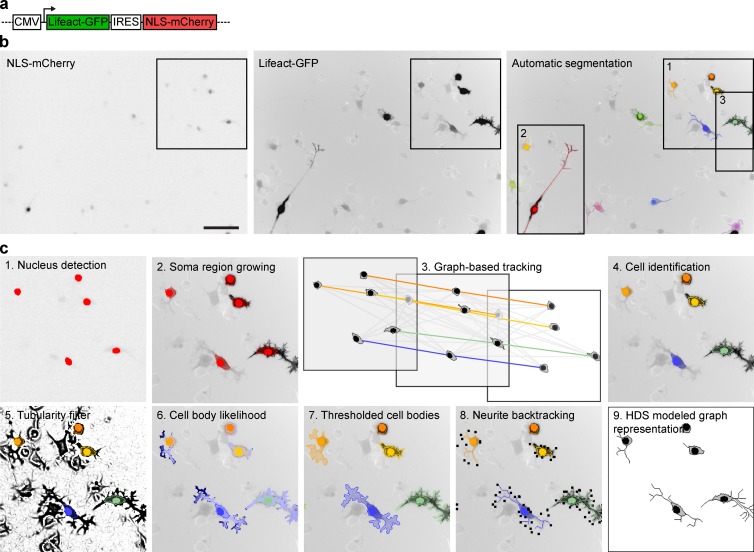
Figure 1.
Tracking and segmentation of neuronal morphodynamics. (a) Schematics of Lifeact-GFP/NLS-mCherry expression vector. (b) Raw NLS-mCherry channel (left), raw Lifeact-GFP channel (middle), and Lifeact-GFP channel (right) with superimposed nucleus, soma, and neurite segmentations color-coded according to cell identity. Bar, 100 µm. Fluorescent images are shown in inverted black-and-white contrast. (c) Different segmentation steps highlighted in magnification from inset 1 from panel b.

