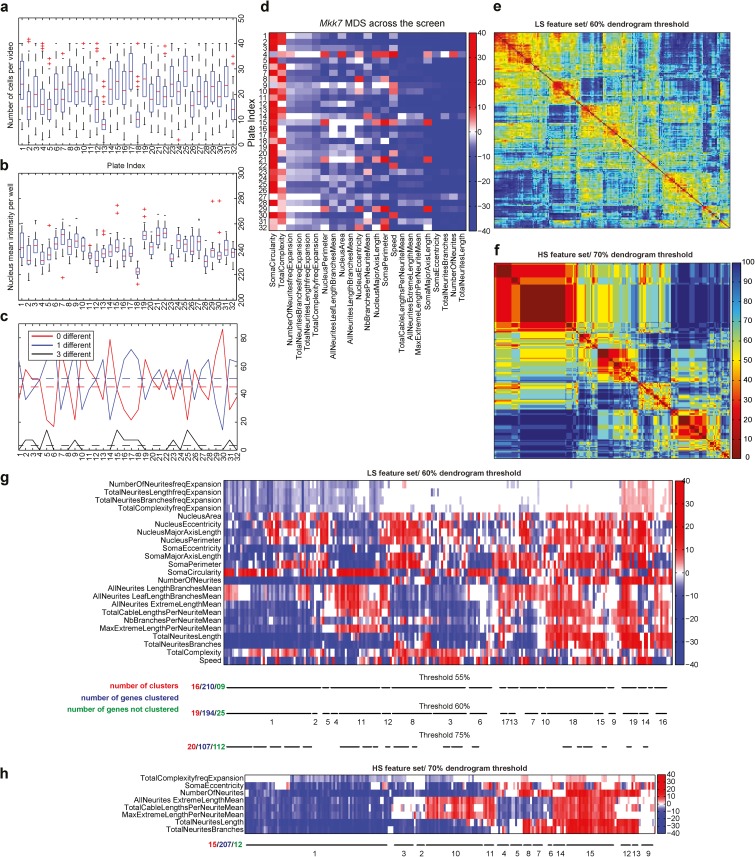
Figure 5.
siRNA screen quality controls and MDS hierarchical clustering. (a) Boxplots quantification of number of cells per field of view across 32 independent experiments. Median (red line), interquartile range (box), and domain (dashed line) are represented. The outliers are plotted individually. (b) Boxplot quantification of NLS-mCherry mean fluorescence intensity across 32 independent experiments. Median (red line), interquartile range (box), and domain (dashed line) are represented. The outliers are plotted individually. (c) Per-plate off-target effect analysis across 32 independent experiments. The analysis takes in consideration the off-target effect of the LS feature set. Black lines indicate the three siRNAs generate different phenotypes. Blue line indicates that two siRNAs generate the same phenotype, but the phenotype of the third siRNA is different. Red lines indicate that the three siRNAs generate the same phenotype. For each plate, the proportion of each case is represented by continuous lines. The dashed line represents the mean value of the case across the whole screen. (d) MDS of MKK7-KD cells across 32 independent experiments. z-score vector maps are shown for each experimental plate. Right bar indicates z-score color code. (e and f) L0 distances comparing all the MDS to each other for low- (e) and high-stringency (f) feature sets. L0 distances were normalized to range between 0 and 100 (percentage). L0 distances are color-coded so that warm colors indicate low distances and cold colors indicate high distances. (g) MDSs hierarchical clustering using the LS feature set. MDS z-scores are color-coded according to the color scale. Identified clusters for different dendrogram thresholds are shown by black lines. The number of clusters, genes clustered, and nonclustered genes are also indicated. (h) MDSs hierarchical clustering using the HS feature set with a dendrogram threshold of 70%.

