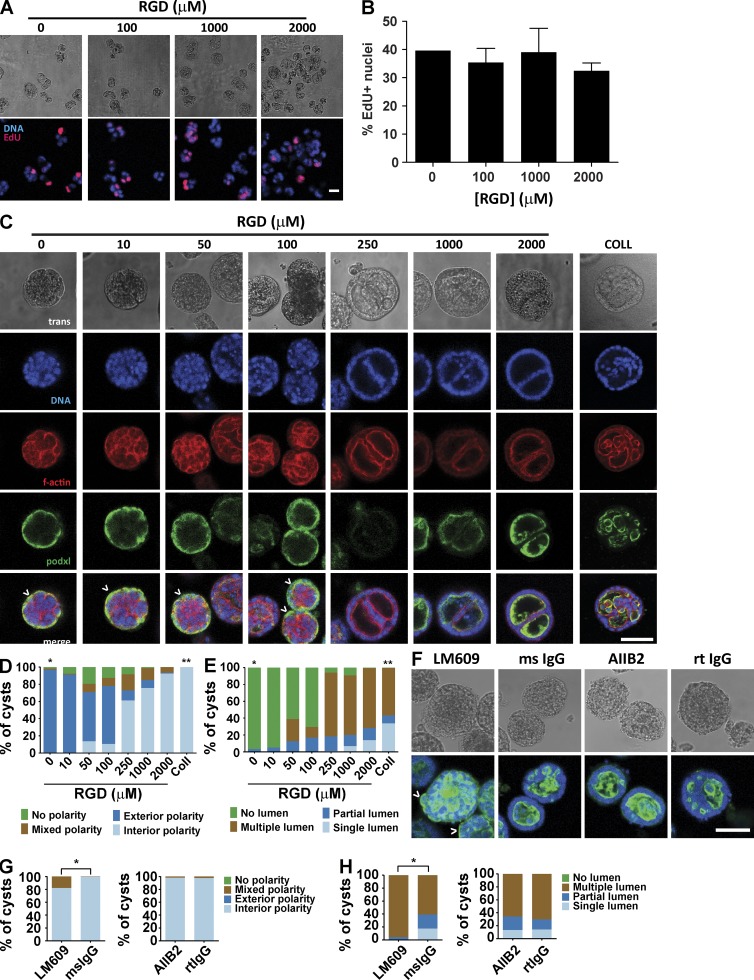
Figure 4.
Adhesive ligand density in PEG-4MAL hydrogel modulates cyst phenotype and apical polarity. (A) Transmitted light and fluorescence microscopy images for MDCK cells cultured for 2 d in 4.0% PEG-4MAL hydrogels incorporating different amounts of RGD. Newly synthesized DNA was labeled by EdU. Bar, 20 µm. (B) Cell proliferation (mean ± SEM) at day 2 as assessed by EdU incorporation (>374 nuclei counted per condition). (C) Transmitted light and fluorescence microscopy images for MDCK cells cultured in 4.0% PEG-4MAL for 10 d and labeled for apical polarity marker gp135/podocalyxin (podxl). Inverted apical polarity indicated by ^. Bar, 50 µm. F-actin, filamentous actin. (D) Distribution of apical polarity phenotypes at day 10 (>78 cysts counted per condition). χ2 test with Bonferroni’s correction; *, P < 0.0001, 0 µM RGD versus every other condition except 10 µM RGD; **, P < 0.0001, collagen versus every other condition except 2,000 µM RGD. (E) Distribution of lumen phenotypes at day 10 (>78 cysts counted per condition). χ2 test with Bonferroni’s correction; *, P < 0.0001, 0 µM RGD versus every other condition except 10 µM RGD; **, P < 0.0001, collagen versus every other group. (F) MDCK cultured for 10 d in 4.0% PEG-4MAL gels with 2,000 µM RGD in the presence of function-blocking antibodies against integrin αVβ3 (LM609) or integrin β1 (AIIB2) or isotype control antibodies (mouse [ms] or rat [rt] IgG). Cysts were labeled with antibodies against gp135/podocalyxin (podxl). Bar, 50 µm. (G) Distribution of lumen phenotypes in F at day 10 (>100 cysts counted per condition). χ2 test; *, P < 0.0001, mouse IgG versus LM609. (H) Distribution of apical polarity phenotypes in F at day 10 (>100 cysts counted per condition). χ2 test; *, P < 0.0001, mouse IgG versus LM609.

