Figure 5.
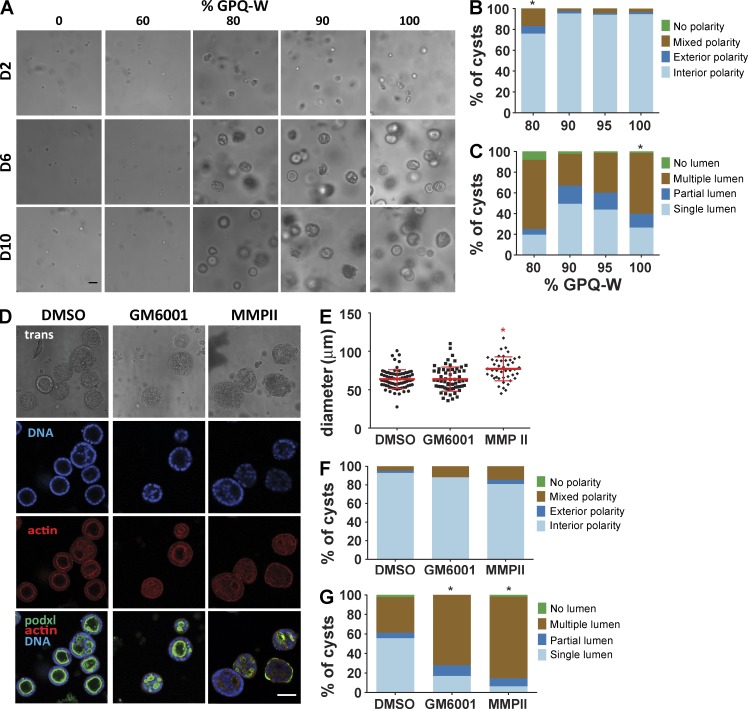
Hydrogel cross-link degradation rate regulates cyst growth, lumen formation, and polarity. (A) Transmitted light microscope images of MDCK cells cultures for 10 d in 4.0% PEG-4MAL hydrogels with 2,000 µM RGD cross-linked with either fast-degrading (GPQ-W) or slow-degrading (GPQ-A) cross-linking peptides titrated from 0% GPQ-W (100% GPQ-A) to 100% GPQ-W (0% GPQ-A). Bar, 50 µm. (B) Distribution of apical polarity phenotypes at day 10 (>135 cysts counted per condition). χ2 test with Bonferroni’s correction; *, P < 0.0001, 80% GPQ-W versus 100% GPQ-W. (C) Distribution of lumen phenotypes at day 10 (>135 cysts counted per condition). χ2 test with Bonferroni’s correction; *, P < 0.005, 100% GPQ-W versus all other conditions. (D) MDCK cells cultured for 10 d in PEG-4MAL hydrogels with 2,000 µM RGD and incubated with MMP inhibitors MMPII or GM6001 or control. Cysts were labeled with rhodamine phalloidin (filamentous actin), Hoechst 3342 (DNA), and an antibody against apical polarity marker gp135/podocalyxin (podxl; green). Bar, 50 µm. (E) Cyst size at day 10 (>44 cysts counted per condition). χ2 test with Bonferroni’s correction; *, P < 0.05, MMPII versus all other conditions. (F) Distribution of apical polarity phenotypes at day 10 (>108 cysts counted per condition). (G) Distribution of lumen phenotypes at day 10 (>108 cysts counted per condition). χ2 test with Bonferroni’s correction; *, P < 0.0001, GM6001 versus DMSO and MMPII versus DMSO.

