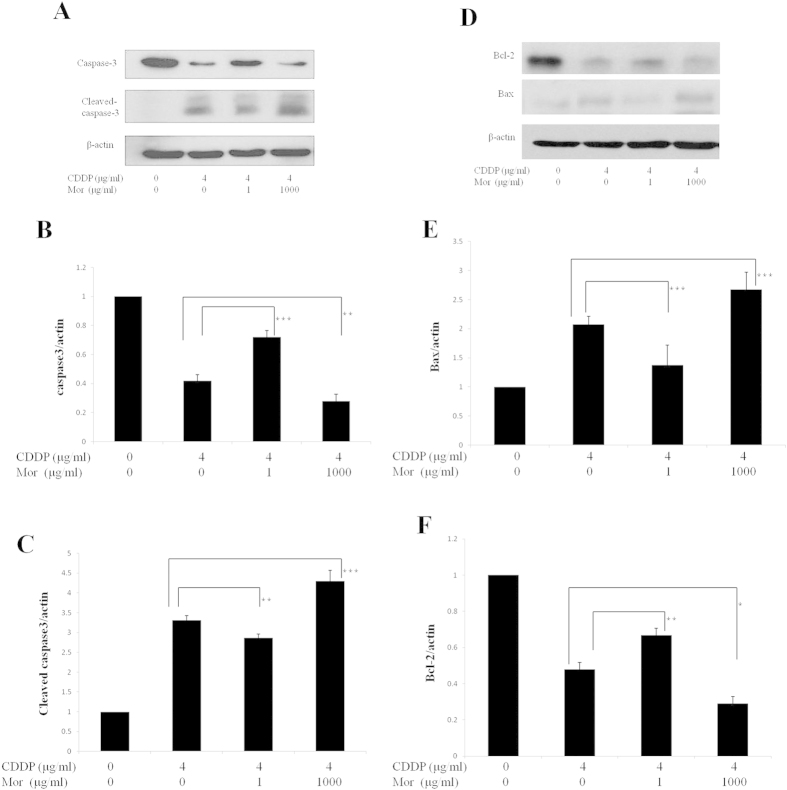
Figure 3. Effect of different concentrations of morphine on cisplatin-induced caspase-3 activation and the changes in the Bax and Bcl-2 protein levels in the CNE-2 cells.
Cells were treated with either 4 μg/ml cisplatin (CDDP) alone or with 4 μg/ml cisplatin (CDDP) in combination with 1 μg/ml morphine (Mor) or 1000 μg/ml morphine (Mor) for 72 h. Extracts from cells were subjected to SDS/PAGE (12% gels) and immunoblotted with (A) anti-procaspase-3 or anti-(cleaved caspase-3). (B,C) The percent of relative intensity obtained from the corresponding western blots. (D) Anti-Bax or anti-Bcl-2 antibodies. (E,F) Percentage of relative intensity obtained from the corresponding western blots. Anti-β-actin antibodies were used as a control for equal loading. *P < 0.05, **P < 0.01, ***P < 0.001. Error bars represent the mean ± SD of triplicates.

