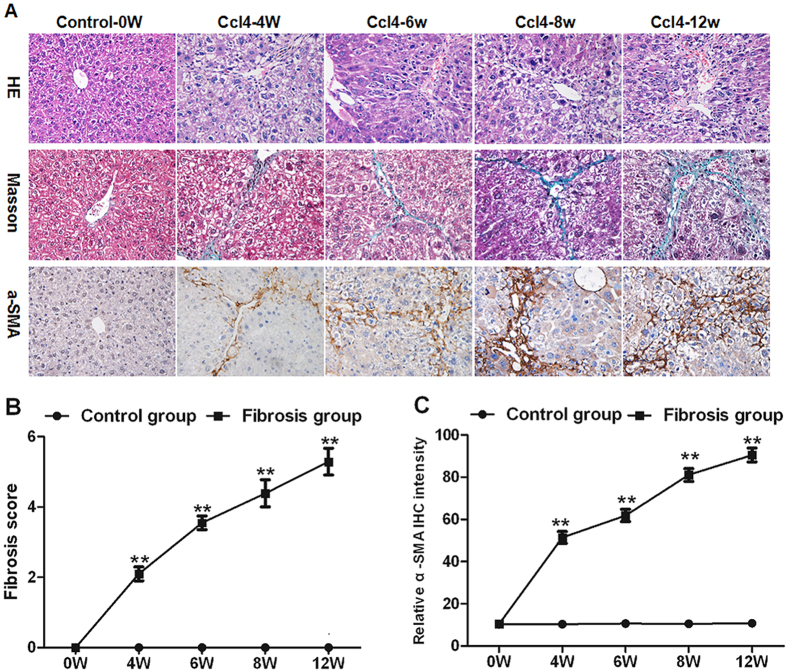
Figure 3. The severity of liver fibrosis in CCl4 administrated mice from 0 to 12 weeks.
(A) Histology was evaluated by H&E staining. Fibrillar collagen deposition was assessed by Masson staining (original magnification, ×400). Activated HSCs in liver sections were quantified by immunohistochemical staining of alpha-smooth muscle actin (α-SMA) (original magnification, ×400). (B) Change of liver fibrosis score from 0 to 12 weeks after CCl4 administration. (C) Change of relative intensity of α-SMA from 0 to 12 weeks. The mean number of α-SMA-positive cells in five ocular fields per specimen was assessed as a percentage area at 400× magnification. **p < 0.01 vs. control subgroups sacrificed at the same time point. Data are shown as mean ± SD.

