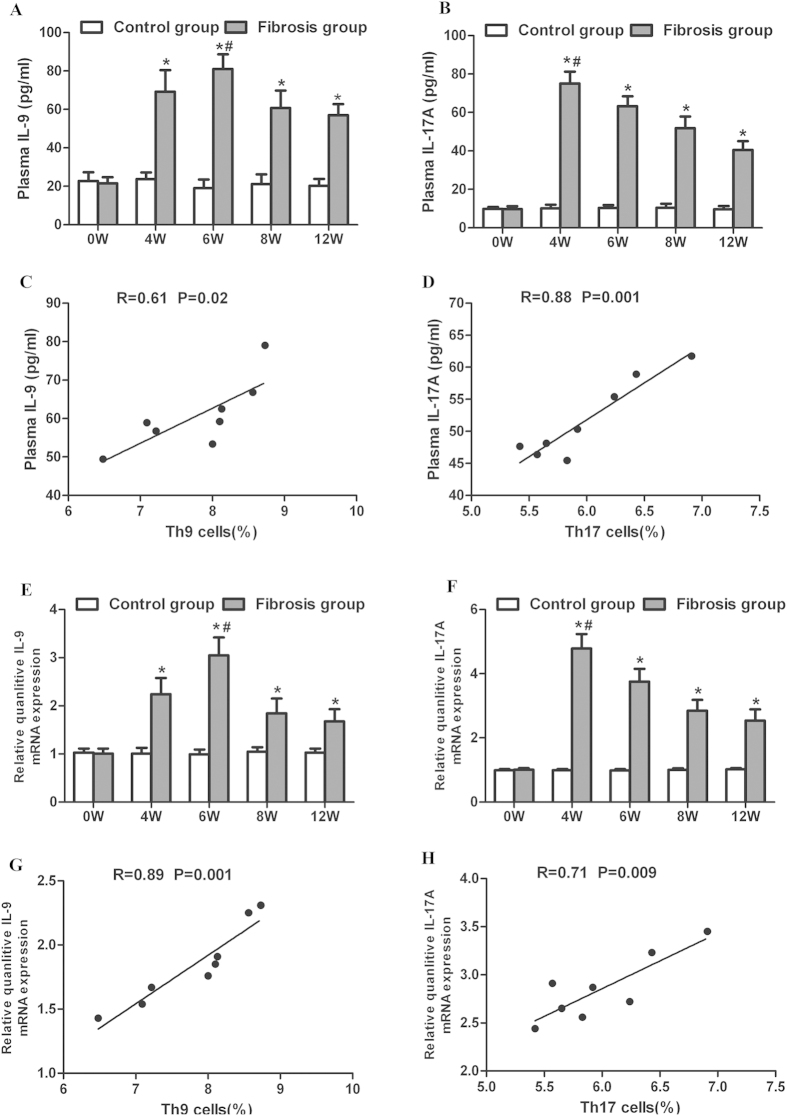
Figure 5. plasma levels and liver expression of IL-9 and IL-17A in mice with hepatic fibrosis.
(A–B) Plasma levels of IL-9 and IL-17A in CCl4 administrated mice at the 0th, 4th, 6th, 8th and 12th week. (C) Correlation between plasma IL-9 levels and splenic Th9 percentages in the mouse model of hepatic fibrosis at the 8th week. (D) Correlation between plasma IL-17 and splenic Th17 cells in the mouse model of hepatic fibrosis at the 8th week. (E–F) Liver expression of IL-9 and IL-17A in CCl4 administrated mice at the 0th, 4th, 6th, 8th and 12th week. (G) Correlation between liver expression of IL-9 and percentages of splenic Th9 cells in mice at the 8th week. (H) Correlation between liver expression of IL-17 and percentages of splenic Th17 cells in mice at the 8th week. *p < 0.01 vs. controls sacrificed at the same time point. #p < 0.05 vs. other subgroups with fibrosis. Data are presented as mean ± SD.

