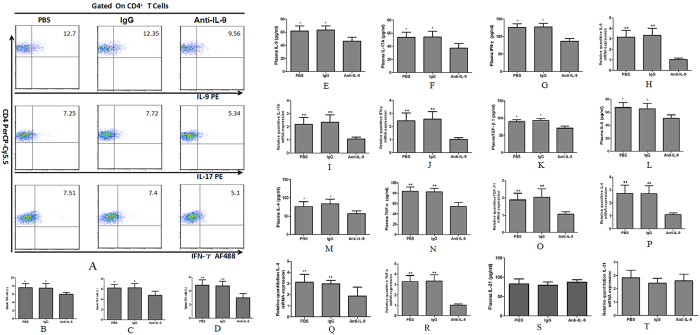
Figure 7. The percentages of splenic Th9, Th17 and Th1 cells, plasma secretion and liver expression of the relevant cytokines in IL-9 neutralized mice with liver fibrosis.
(A) Characterization of splenic Th9 and Th17 cells in fibrosis mice treated with anti-IL-9Ab, PBS and IgG. (B–D) The percentages of splenic Th9, Th17 and Th1 cells in anti-IL-9Ab, IgG and PBS treated groups. (E–G) Plasma levels of IL-9, IL-17A and IFN-γ in anti-IL-9Ab, IgG and PBS treated groups. (H–J) The liver mRNA levels of IL-9, IL-17A and IFN-γ in anti-IL-9Ab, PBS and IgG treated groups. (K–N) The plasma levels of TGF-β1, IL-6, IL-4 and TNF-α in anti-IL-9Ab, IgG and PBS treated groups. (O–R) The liver mRNA levels of TGF-β1, IL-6 IL-4 and TNF-α in anti-IL-9Ab, IgG and PBS treated groups. (S) The plasma levels of IL-21 in anti-IL-9Ab, IgG and PBS treated groups. (T) The liver mRNA levels of IL-21 in anti-IL-9Ab, IgG and PBS treated groups. **p < 0.01 compared with control PBS or IgG treated mice. Data are presented as mean ± SD.

