
Figure 3. Consensus co-expression patterns of the adult brain.
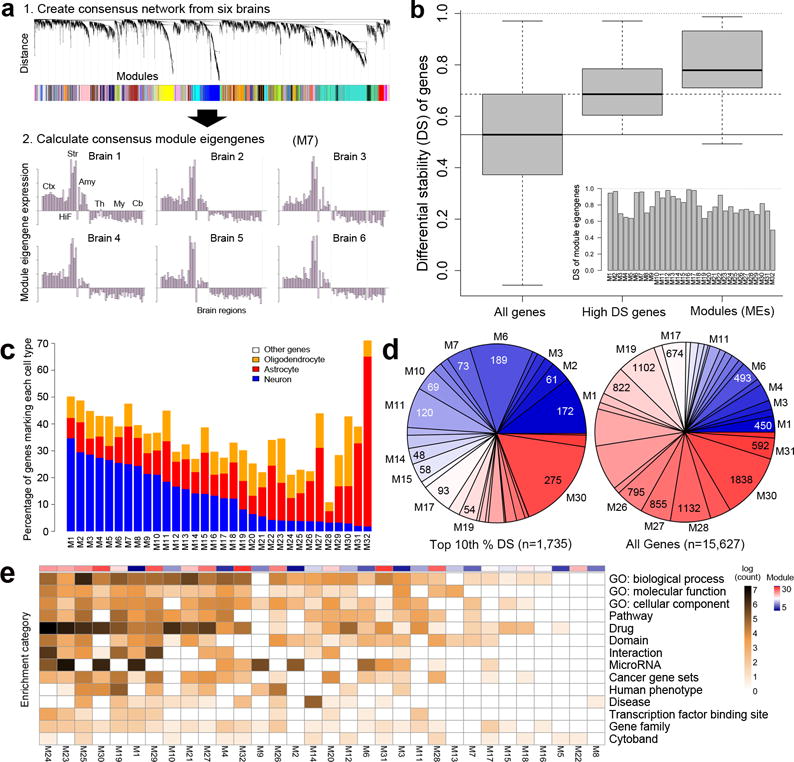
(a) Schematic showing network construction using consensus WGCNA on high DS genes22. Panel 1: Assignment of genes to modules. Panel 2: Module eigengene expression for M7 showing consistent patterning across all 6 brains with peak expression in the striatum. (b) Distribution of DS scores for all genes (left) and genes with ΔBR> 0.528 used for initial network construction (middle). DS metric applied to MEs demonstrates very high consistency of module patterns across brains (right). Inset shows DS score for each ME. (c) Percentage of known neuron, astrocyte and oligodendrocyte-enriched genes in 32 modules, ordered by proportion of neuron-enriched gene membership. (d) Module composition for the top 10% of DS genes (left) versus all genes (right), with modules color-coded from high (blue) to low (red) neuron-enriched gene membership. Note larger proportion of genes assigned to more neuronal modules for high DS genes compared to all genes. (e) Majority of gene annotations are associated with a subset of modules. Log counts of number of significant (B&H corrected, FDR q<0.05) enrichments for gene ontology terms, protein interaction, cytoband, gene families, pathways, and drug interactions. Modules ordered from most (M24, left) to fewest (M8, right) annotations, with neuron-enriched gene membership indicated in top color bar.