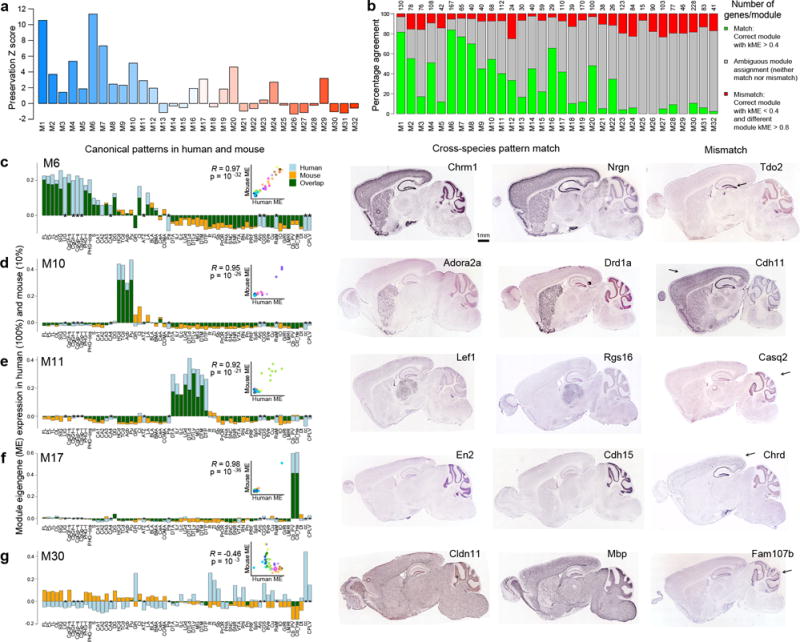
Figure 6. Module preservation from human to mouse.

(a) Mouse-human module preservation index, which measures conserved within-module gene co-expression in an anatomy-independent fashion, shows the highest preservation of some of the most neuronal modules (M1, M6, M7). (b) Conservation of anatomical patterning, defined as the proportion of mouse genes correlated at ρ > 0.4 to the corresponding human ME (green bars). A subset of genes in each module are both poorly correlated to the human eigengene (gray bars), and very highly correlated to a different human module eigengene (ρ > 0.8, red bars). (c–g) Correspondence of ME anatomical patterning between human and mouse. Histogram representation of ME pattern in human (light blue) and mouse (orange), with overlap in green, demonstrating highly conserved patterns for M6, M10, M11 and M17, while M30 is weakly anti-correlated. Inset panels show correlation between mouse and human. Asterisks indicate samples present in human but not mouse. Mouse ISH for genes with matching and mismatched patterns in right panels, representing genes in the green and red categories in (b). Arrows indicate areas of differential regulation in mouse. All ISH images from the Allen Mouse Brain Atlas.
