
Figure 4. Boxplot graphics of the dynamics of the variation of fluoride concentration after application of AmF and NaF.
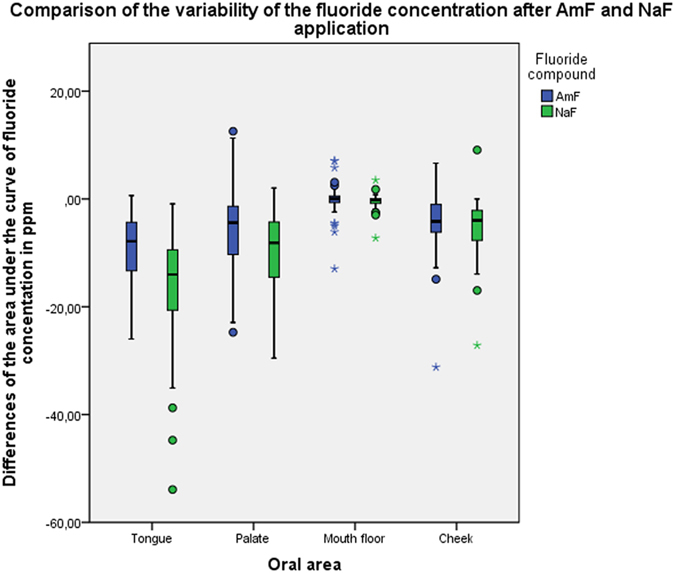
The AUC has been calculated from the differences between T1-T0, T2-T1 and T3-T2.
Official websites use .gov
A
.gov website belongs to an official
government organization in the United States.
Secure .gov websites use HTTPS
A lock (
) or https:// means you've safely
connected to the .gov website. Share sensitive
information only on official, secure websites.
The AUC has been calculated from the differences between T1-T0, T2-T1 and T3-T2.