
Figure 6. MOAS formation is associated with fission delay.

(a) Real-time imaging (t, seconds) of mitochondrial axonal movement in live cortical neurons (E17) from WT (left panel), APP mice (middle panel), and WT neurons treated with 2 μM PGJ2 for 30 min prior to imaging (right panel). Arrows indicate progress along the axon of the same daughter mitochondrion produced after fission (asterisk) from parental organelle. Thirty individual mitochondria were examined from each of the three movies generated for each condition. Experiments were repeated in three independent platings. (b) Model of two-step reaction leading to fission arrest where the first step (k1) represents Drp1 recruitment to a mitochondrion and subsequent self-assembly resulting in formation of early fission intermediates. The second step (k2) consists of either a rapid GTP hydrolysis-driven constriction resulting in mitochondrial membrane scission (k2 ≫ k1) or a decrease in the membrane constriction/scission rate resulting in MOAS formation (k2 ≪ k1). (c) Kinetic model of MOAS accumulation as an intermediate product during the reaction  calculated as
 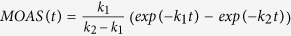 for three different scenarios. First: k2 ≪ k1 (green line) where
  and
and  . Second: k2 ≫ k1 (red line) where
  and
and  . Third:
  (blue line) where
  and
and  . Fission rate of mitochondria in cortical neurons used for calculations for
  fission/mitochondria/s−1.