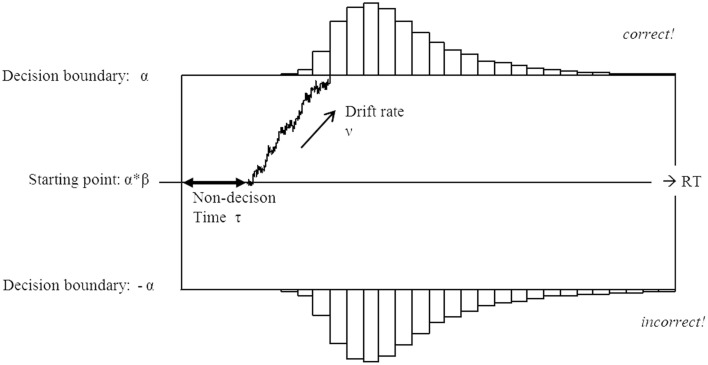
Figure 1.
Schematic illustration of the diffusion model. The decision is made based on evidence accumulated with the drift rate ν. The average drift rate is positive on trials with the upper boundary being the correct response, and negative on trials with the lower boundary being the correct response. In this scheme the upper boundary represents the correct response. Non-decision processes, such as stimulus encoding and motor preparation are contained in the non-decision time τ. The decision is made once the amount of evidence exceeds one of the pre-defined decision boundaries α or 0. An unbiased decision process starts at the point , with a bias β of 0.5. A β larger than 0.5 indicates a bias toward the upper decision boundary, and a β smaller than 0.5 indicates a bias toward the lower decision boundary.

