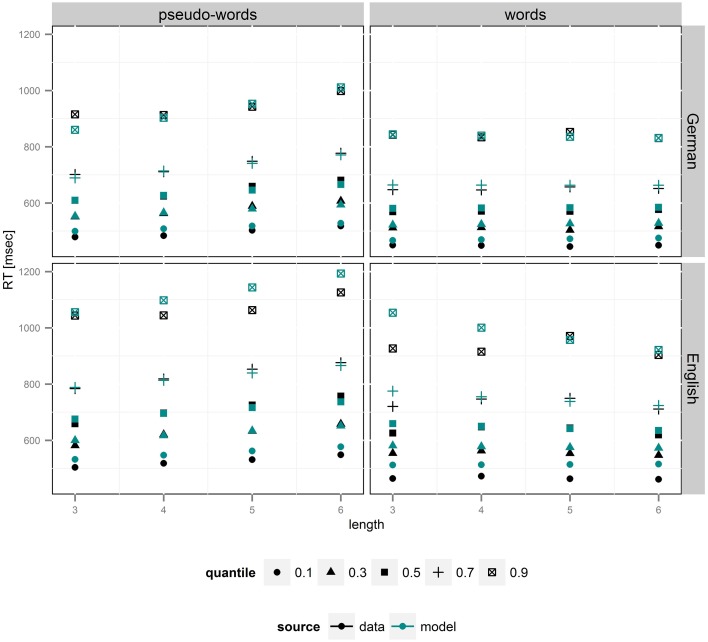
Figure 2.
Plot of group RT quantiles (q = 0.1, 0.3, 0.5, 0.7, 0.9) for correct responses based on empirical data (black) and group-level diffusion model parameters (blue). Increase in non-decision time is reflected in an upward shift in shortest reaction times, which is strongest in pseudo-words. Lower drift rates, in contrast, lead to acceleration of slowest RTs, i.e., the right tail of the RTs distributions, an effect strongly present for German pseudo-words of different lengths.

