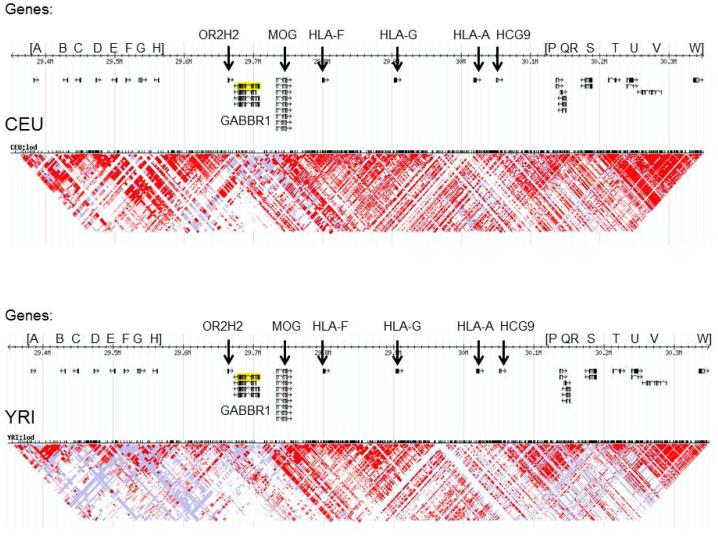
FIGURE 2. Linkage disequilibrium and genes (A to W) in regions upstream and downstream of GABBR1 (chromosome 6p21.3) in the HapMap CEU (Caucasian) and YRI (African) populations.
Genes downstream (to left) of GABBR1:
[A = OR5U1; B = OR5V1; C = OR12D3; D = OR12D2; E = OR11A1; F = ORI0C1; G = OR2H1 (A – G are an olfactory receptor gene cluster).; H = MASIL];
OR2H2
Genes upstream (to right) of GABBR1:
MOG; HLA-F; HLA-G; HLA-A; HCG9
[P = ZNRD1; Q = PPP1R11; R = RNF39; S = TRIM31; T = TRIM40; U = TRIM15; V = TRIM26; W = FLJ45422]
Distance from GABBR1 to: OR2H2 = 13.3 kb; MOG = 23.8 kb; HLA-F = 90 kb.
Distance across whole region shown in the figure is approximately 867 kb.

