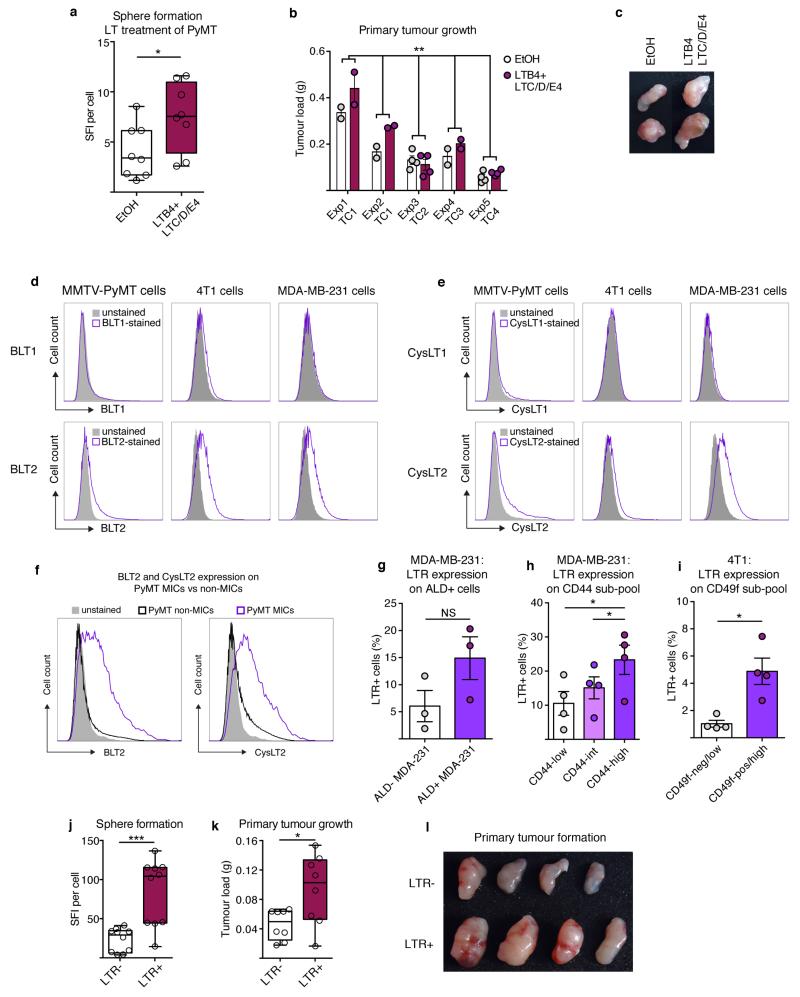
Extended Data Figure 7. LTRs are expressed on mouse and human breast cancer cells and enriched on metastasis-initiating and highly tumorigenic cancer cell sub-pools.
a, Sphere formation potential of MMTV-PyMT cells under presence of LTB4 or LTC/D/E4 (technical replicate n = 8 per group of biological triplicates). b, c, Three-day LTB4 and LTC/D/E4-treated MMTVPyMT cells in adherent culture were analysed for primary tumour initiation potential by orthotopic transplantation of 104 cells in Rag1-null mice (n = 14 per group) (b). Exp, experiment; TC, tumour cell isolation. Representative image of tumours is shown (c). d, e, Flow cytometric analysis of primary MMTV-PyMT cancer cells, the mouse mammary cancer cell line 4T1 and the human breast cancer cell line MDA-MB-231 for expression of BLT1 or BLT2 (d) as well as CysLT1 or CysLT2 (e). f, Representative flow cytometric analysis of BLT2+ and CysLT2+ cells among MMTV-PyMT non-MICs and MICs. g–i, Flow cytometric quantification of LTR expression on Aldefluor (ALD)+ (n = 3 per group) (g) or CD44high MDA-MB-231 cells (n = 4 per group) (h) as well as CD49f+/high 4T1 cells (n = 4 per group) (i). j–l, Sorted LTR+ or LTR− MMTV-PyMT tumour cells were plated in non-attachment conditions followed by sphere quantification at day 10 post-seeding (technical replicate n = 10 per group of biological duplicates) (j) or 103 cells grafted onto the mammary gland of Rag1-null mice for analysis of tumour formation potential. Tumour burden was determined by weighing (n = 8 per group) after 3 weeks (k) and representative image of tumours is shown (l). Statistical analysis by two-sided t-test (a, h–k) and two-way ANOVA (b). Data are represented as mean ± s.e.m. NS, not significant, *P < 0.05, **P < 0.01, ***P < 0.001.

