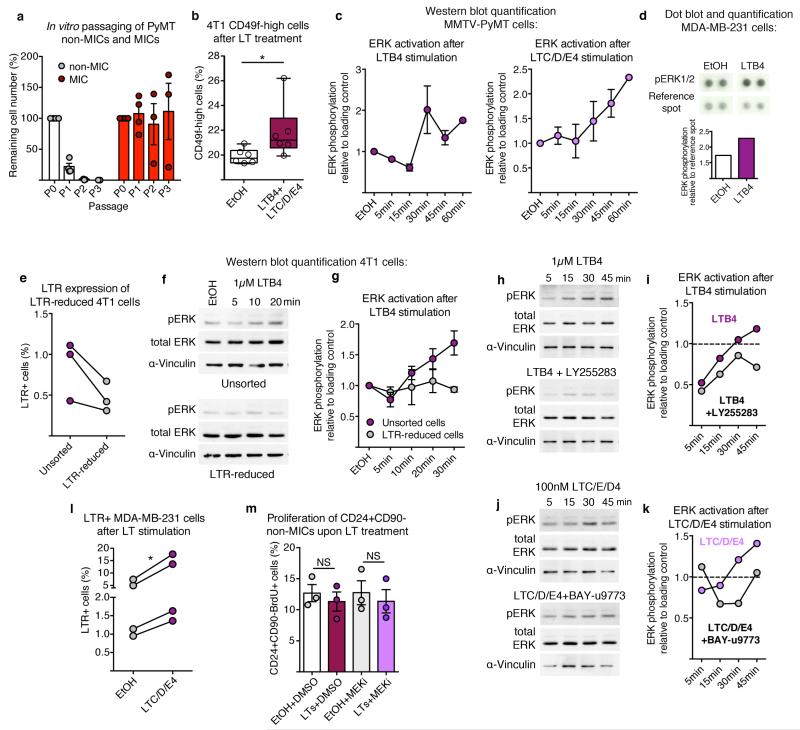
Extended Data Figure 8. LTs promote stemness within the total cancer cell population by specifically promoting proliferation of MICs.
a, In vitro passaging (P indicates passage number) in non-adherent conditions of sorted CD24+CD90+ MICs and CD24+CD90− non-MICs (n = 4 per group for P0+P1 and n = 3 per group for P2+P3). Quantification was performed by determination of percentage of remaining cell number after 7–10 days. b, Flow cytometric quantification of 3-day LT-treated 4T1 cells for frequency of highly tumorigenic CD49fhigh cells (n = 6). c, Quantification of western blots for ERK1/2 phosphorylation of MMTV-PyMT cells following LTB4 (left) or LTC/D/E4 (right) stimulation relative to α-vinculin as shown in Fig. 3i (n = 2 per time point except n = 9 (30 min LTB4)). d, Dot blot and quantification of ERK1/2 phosphorylation in MDA-MB-231 cells after 3 h stimulation with LTB4 measured by R&D Proteome Profiler Human Phospho-Kinase Array (ARY003B; one-membrane array). e, Flow cytometric quantification of LTR expression of sorted LTR-reduced 4T1 cells (n = 3 per group). f, g, Representative analysis and quantification of western blots for total ERK1/2 and ERK1/2 phosphorylation relative to α-vinculin of unsorted 4T1 cells or 4T1 cells sorted for LTR negativity (n = 2 per group). h–k, Analysis and quantification of western blot for total ERK1/2 and ERK1/2 phosphorylation relative to α-vinculin of 4T1 cells following LTB4 (h, i) or LTC/D/E4 (j, k) stimulation in the presence of BLT2 inhibitor LY255283 or CysLT2 inhibitor BAY-u9773, respectively (one time series). Dotted lines in indicate the control level of ERK1/2 phosphorylation. The decrease of ERK1/2 phosphorylation observed after 5–15 min when adding both leukotrienes and their receptor inhibitors is due to the increase in ethanol concentration. Data are shown as ERK1/2 phosphorylation recovery and increase from 5 to 45 min after stimulation (i, k). l, Flow cytometric quantification of 3-day LTC/D/E4-treated MDA-MB-231 cells for frequency of LTR+ cells (n = 4 per group). m, Three-day LT-treated MMTV-PyMT cells in adherent culture were analysed for BrdU incorporation of CD24+CD90− non-MICs in the additional presence of PD0325901 MEK inhibitor (MEKi; n = 3 per group). DMSO, dimethylsulfoxide treated; EtOH, ethanol treated. Statistical analysis by two-sided t-test (l, m) and one-sided t-test (b). Data are represented as mean ± s.e.m. NS, not significant, *P < 0.05. Blot source data are shown in Supplementary Fig. 1.

