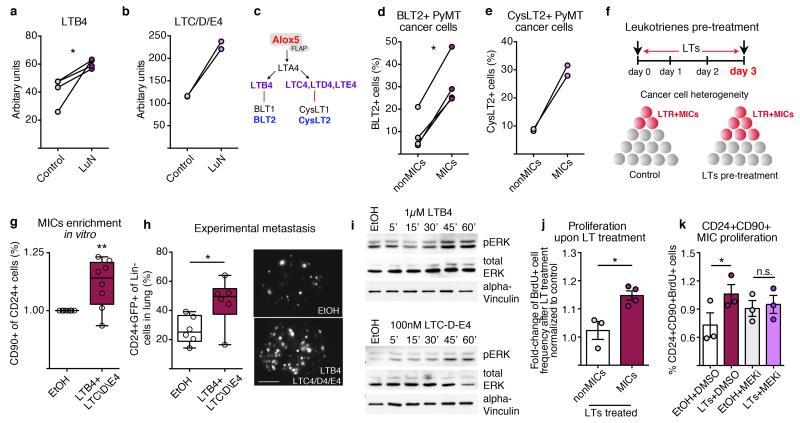
Figure 3. LTs enrich for MICs and tumorigenicity.
a, b, Enzyme immunoassay detecting LTB4 (n = 4 per group) (a) or LTC/D/E4 (n = 2 per group) (b). c, Overview of LTs and LTRs. d, e, Flow cytometric quantification of BLT2+ (n = 4 tumours) (d) and CysLT2+ cells (n = 2 tumours) (e) among indicated sub-pools. f–h, Representation of LT treatment (f): frequency of MICs (n = 8 per group) (g); and experimental lung metastasis (n = 6 per group) with representative images of GFP+ colonies. Scale bar, 3 mm. Lin, CD45 CD31 TER119. i, Western blot of ERK1/2 phosphorylation and total ERK1/2 levels of LTB4- or LTC/D/E4-treated cells for indicated minutes. Loading control: α -vinculin. j–k, 5-Bromodeoxyuridine (BrdU) incorporation comparing LT-treated MICs with non-MICs (n = 3 (non-MICs), n = 4 (MICs)) (j) or MICs treated with LTs and/or PD0325901 MEK inhibitor (MEKi; n = 3 per group) (k) DMSO, dimethylsulfoxide treated; EtOH, ethanol treated. Statistical analysis by two-sided t-test (a, d, h, j, k) and one-sample t-test (g). Data are represented as mean ± s.e.m. NS, not significant. *P < 0.05, **P < 0.01. Blot source data are in Supplementary Fig. 1.

