
Fig. 1.
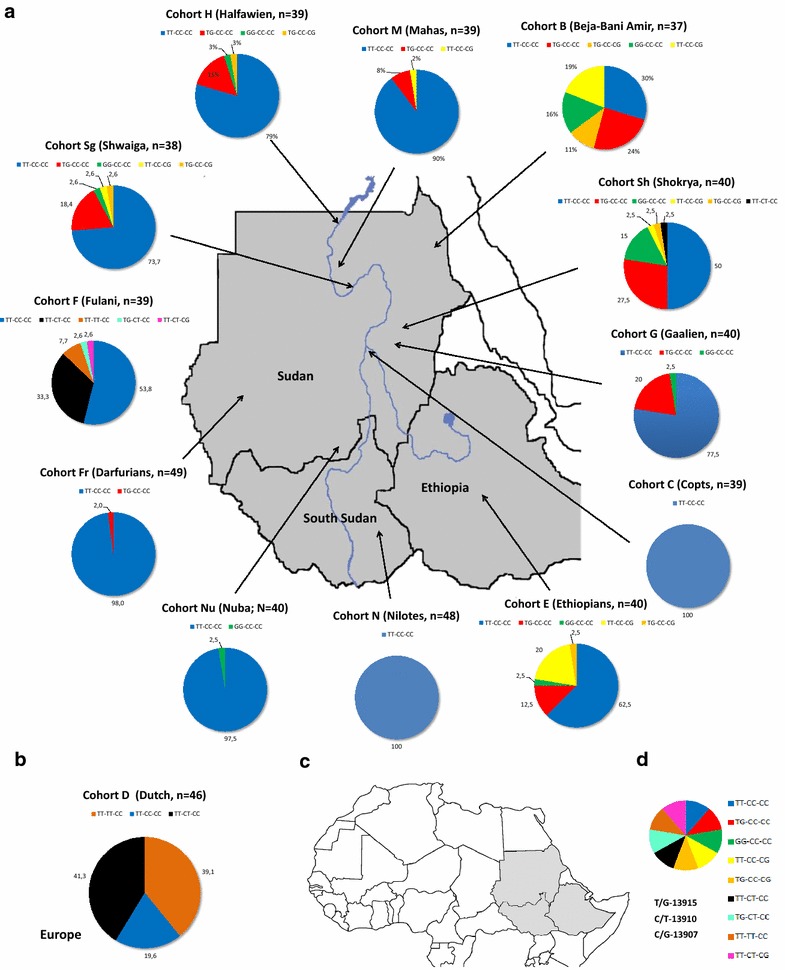
Distribution of MCM6 haplotypes among different East African populations: a Pie charts representing the proportion of each haplotype among the selected populations in this study. The arrows show the approximate locations of the populations. The Fulani is a nomadic group and has no specific geographical location. b We additionally added a European (Dutch) cohort to compare the different groups. c The location of the Sudan, South Sudan and Ethiopia and the neighboring countries in Africa. d The key and distribution of LP haplotypes, columns of bases represent the genotypes of T/G-13915, C/T-13910 and C/G-13907 respectively. Modified from d-maps.com